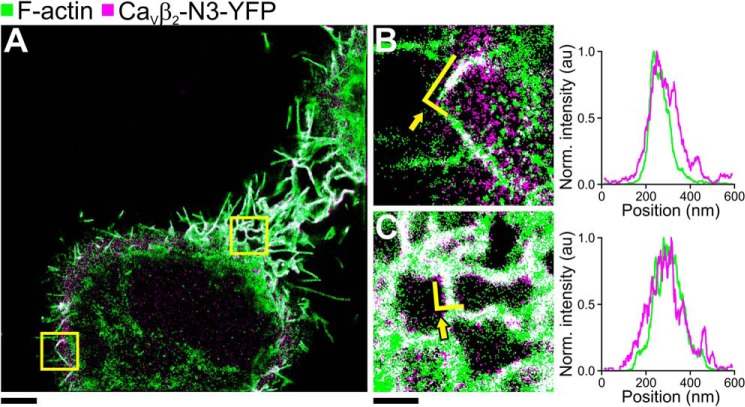
FIGURE 3.
SMLM image of CaVβ2-N3-YFP expressed in HeLa cells. A, wide field SMLM image of HeLa cells with the focus around the midsection of the cell. F-actin was labeled with Alexa Fluor® 647 phalloidin (green). CaVβ2-N3 was visualized via a fused YFP (magenta). The overlay of F-actin and CaVβ2-N3-YFP is shown in white. B and C, 4 × 4-μm subsection indicated by the yellow squares in A. The right panels show the projections of the single molecule localizations delineated by the yellow lines indicated by arrows in B and C. Green lines represent localizations from F-actin, and magenta lines represent localizations from CaVβ2-N3-YFP. The scale bar for A represents 4 μm. The scale bars for B and C represent 1 μm. Norm., normalized.

