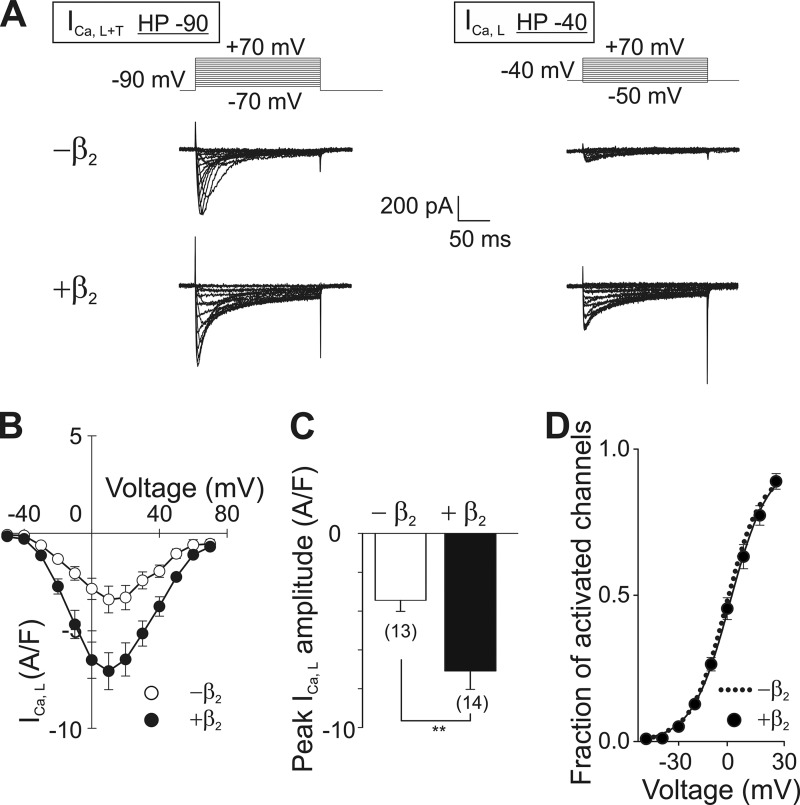
FIGURE 5.
Overexpression of CaVβ2-N3 increases L-type calcium currents in HL-1 cells. A, pulse protocol and representative current traces from HL-1 cells showing the superposition of T- and L-type calcium currents (ICa,L+T) recorded from a holding potential of −90 mV (HP −90) are shown in the left panel. LCC current traces (ICa,L) recorded from a holding potential of −40 mV (HP −40) are shown in the right panel. Native HL-1 cells (−β2) or cells transduced with CaVβ2-N3-mRFP (+β2) were recorded using both protocol pulses. B, average current density to voltage (I-V) curves for ICa,L from cells as shown in A. C, comparison of the peak amplitudes of ICa,L obtained from the I-V plots shown in B. D, fraction of activated channels versus voltage as calculated from B for cells overexpressing CaVβ2-N3 (black circles). For comparison the fit to a Boltzmann function obtained from nontransduced cells (dotted line) is shown. The number of cells is given in parentheses. **, p ≤ 0.01.

