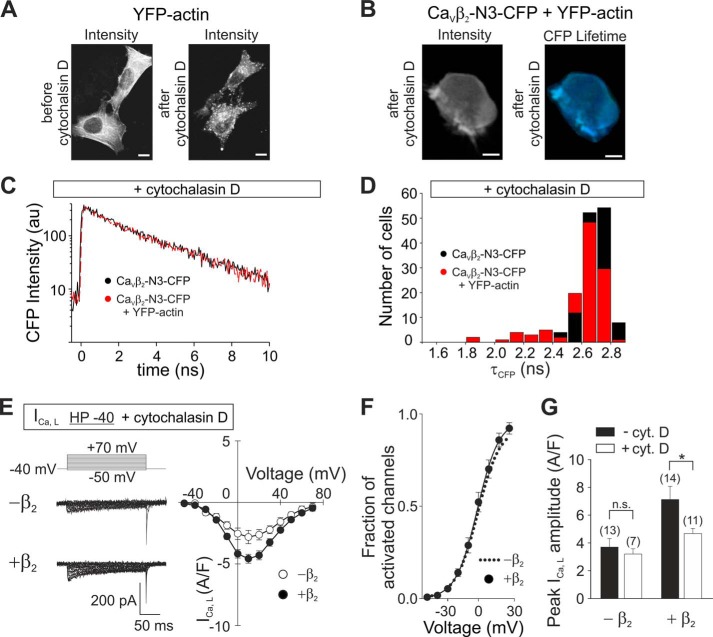
FIGURE 6.
Disruption of the actin cytoskeleton by cytochalasin D inhibits CaVβ2-actin interaction and the increase of ICa,L induced by this subunit in HL-1 cells. A, representative images of HEK293 cells expressing only YFP-actin acquired using two-photon excitation microscopy before and after incubation in 100 μm cytochalasin D for 1 h. Scale bars, 10 μm. B, representative images of HEK293 cells co-expressing CaVβ2-N3-CFP and YFP-actin acquired using two-photon excitation microscopy after incubation in 100 μm cytochalasin D for 1 h. Scale bars, 10 μm. C, representative plots of the decay of CaVβ2-N3-CFP fluorescence intensity following incubation with cytochalasin D from cells expressing this construct alone or together with YFP-actin. D, histogram of the donor fluorescence lifetime (τCFP) for cells expressing CaVβ2-N3-CFP alone or together with YFP-actin after cytochalasin D treatment. E, representative current traces from HL-1 cells showing L-type calcium currents (ICa,L) recorded with the indicated protocol pulse from a holding potential of −40 mV (HP −40) and average current density-to-voltage (I-V) curves. Native HL-1 cells (−β2) or cells transduced with CaVβ2-N3-mRFP (+β2) are shown after incubation with 100 μm cytochalasin D. F, fraction of activated channels versus voltage following incubation with cytochalasin D as calculated from B is shown for cells overexpressing CaVβ2-N3 (black circles). For comparison, the fit to a Boltzmann function obtained from nontransduced, noncytochalasin treated cells (dotted line) is shown. G, graph of the ICa,L peak amplitudes calculated from the I-V plots shown in E. Black bars show values from nontreated cells (from Fig. 5C), whereas white bars show values from cells incubated with cytochalasin D. The difference after treatment with cytochalasin is significant (p ≤ 0.01) only for cells overexpressing CaVβ2. CytD, cytochalasin D.

