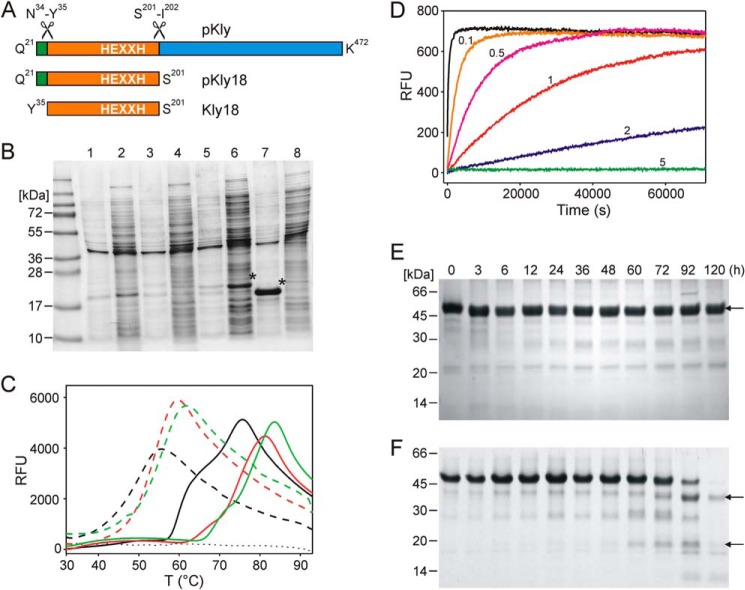
FIGURE 1.
Effect of the Kly18 propeptide in vitro and in vivo. A, scheme depicting the domain structure of T. forsythia karilysin. Numbering according to UniProt D0EM77. B, SDS-PAGE of cultures of wild-type and E156A variants of pKly18 and Kly18. Lanes 1 and 2, insoluble and soluble fractions of wild-type pKly18 (from pKAR10), respectively. Lanes 3 and 4, insoluble and soluble fractions of wild-type Kly18 (pKAR12), respectively. Lanes 5 and 6, insoluble and soluble fractions of pKly18-E156A (pKAR11), respectively. Lanes 7 and 8, insoluble and soluble fractions of Kly18-E156A (pKAR13), respectively. Overexpressed proteins are labeled with an asterisk. C, unfolding transition curves showing temperature-dependent change in fluorescence of pKly18-E156A (pKAR5; solid line) and Kly18-E156A (pKAR6; dashed line) in the absence (black curve) and presence of CaCl2 (1 mm, red curve; 5 mm, green curve). The blank curve is indicated with a dotted line. D, proteolytic activity of Kly18 (pKAR1) at 37 °C using substrate Mca-R-P-K-P-V-E-Nva-W-R-K(dnp)-NH2 at 10 μm in the absence (0) and presence of 0.1, 0.5, 1, 2, and 5 mm propeptide mimic. E and F, stability of mutant pKly-Y35A (E) and mutant pKly-Y35A/D25A (F) over time. Kly48, Kly38, and Kly18 are indicated by arrows.

