FIGURE 2.
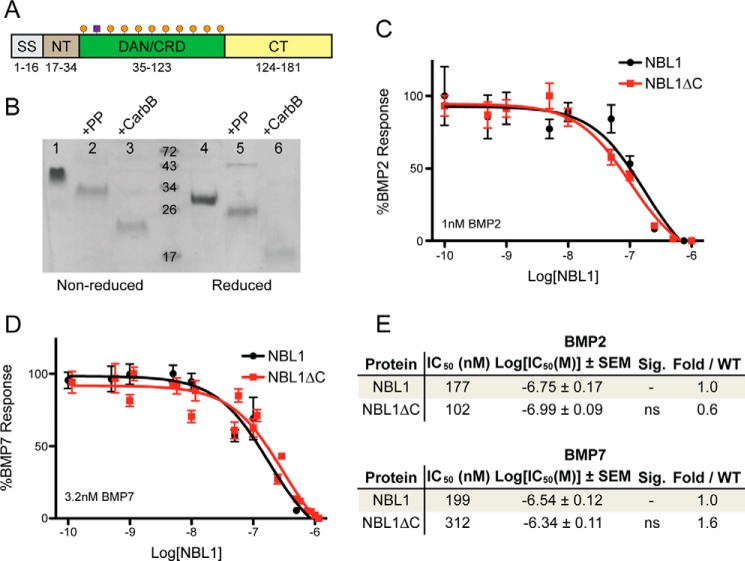
Comparison of NBL1 and NBL1ΔC. A, schematic of the NBL1 protein. The protein can be separated into 4 regions: the signal sequence (SS), N terminus (NT), cysteine-rich or DAN domain (DAN/CRD), and C terminus (CT). Numbers under the diagram represent the amino acids in NBL1 composing each region. Orange circles represent cysteines and the purple box represents glycosylation. B, SDS-PAGE gel of purified NBL1 with the Myc-His6 tag used for purification in lanes 1 and 4, full-length NBL1 after remove of the purification tag using Prescission Protease (PP) in lanes 2 and 5, and NBL1 after cleavage using carboxypeptidase B (NBL1ΔC) in lanes 3 and 6. Proteins in lanes 4–6 were reduced using 10 mm β-mercaptoethanol. C and D, luciferase reporter assay testing the activity of NBL1 and NBL1ΔC against (C) 1 nm BMP2 and (D) 3.2 nm BMP7. E, table summarizing inhibition data for NBL1 and NBL1ΔC. IC50 values and significance were determined from Luciferase reporter assays using the Prism software package. NS, not significant based upon a p value of 0.05.

