
FIGURE 4.
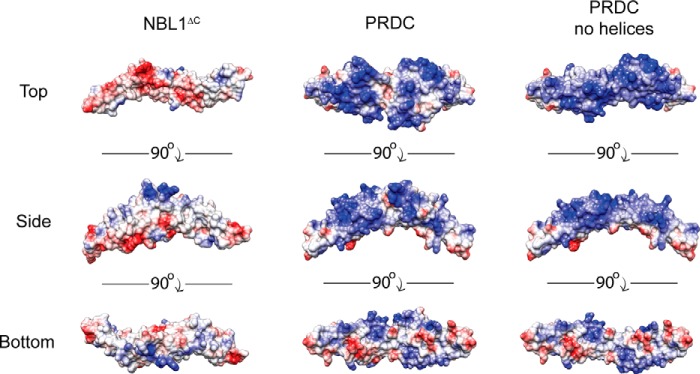
Comparison of NBL1ΔC and PRDC electrostatics. Three views of NBL1ΔC, PRDC, and PRDC lacking its N-terminal helices, depicting the electrostatic surface potential of these proteins from the top, bottom, and side perspectives. Surface potential was calculated using APBS and the proteins are colored based on a scale from −10 to 10 kbT/ec (red to blue).