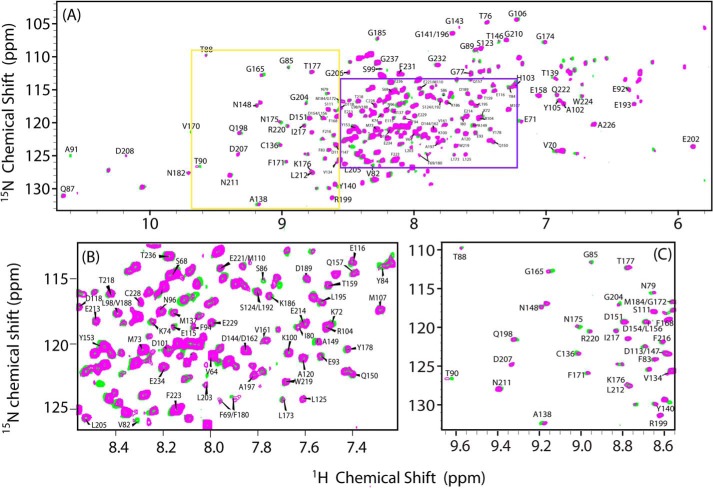
FIGURE 6.
Two-dimensional 1H/15N HSQC spectra of FBD in its free form and in complex with cyt c. A, superposition of 1H/15N HSQC spectra of 15N-labeled FBD in the free form (green) and in complex with unlabeled cyt c (magenta). The FBD/cyt c molar ratio was 1:5 in 100 mm potassium phosphate buffer at pH 7.4 containing 5% (w/v) glycerol. B and C, expansions of crowded regions of the spectra given in A.

