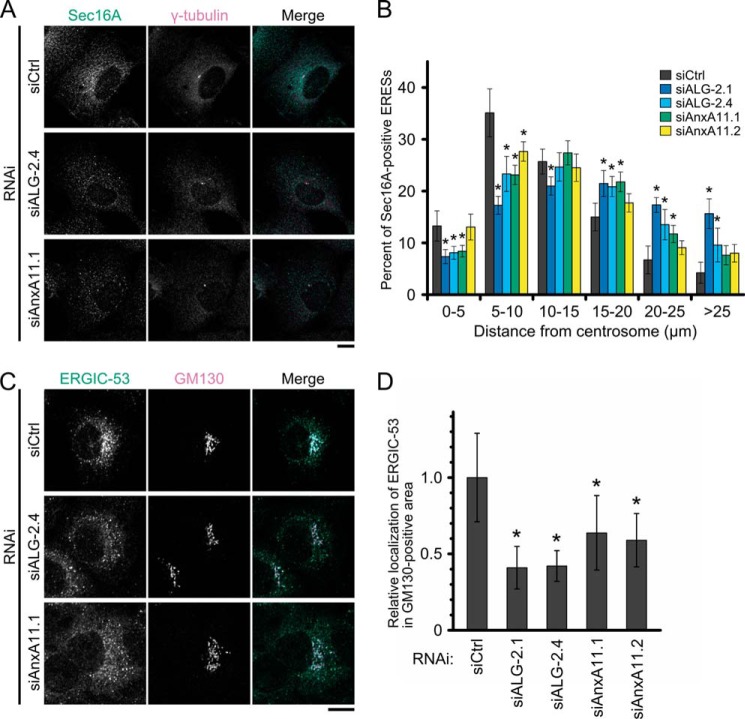
FIGURE 5.
Effects of ALG-2 or AnxA11 knockdown on intracellular positioning of the Sec16A-positive compartment and distribution of ERGIC-53. A, representative confocal z-stack projection images of siRNA-treated HT1080 cells stained with antibodies against Sec16A and γ-tubulin. Cells were transfected with control (siCtrl), ALG-2 (siALG-2.4), or AnxA11 (siAnxA11.1) siRNAs, followed by fixation with 4% paraformaldehyde in phosphate buffer for 1 h at room temperature and permeabilization with 0.1% Triton X-100. Then cells were double-stained with antibodies against Sec16A and γ-tubulin. The images are superimpositions of serial optical sections taken through the whole thickness of the cell. The right panel in each row shows merged images with the pseudocolors as follows: green (Sec16A) and magenta (γ-tubulin). Scale bar, 10 μm. B, histogram of distribution of the Sec16A-positive compartments. Cells treated with siRNAs were processed in the same manner except for permeabilization with digitonin. The ratio of fluorescence intensity for Sec16A in individual Sec16A-positive compartments to that in whole Sec16A-positive compartments was calculated and grouped into bins of distances of 5 μm from the γ-tubulin-positive centrosome. Values and bars in each bin represent mean percentages ± 95% confidence intervals of cells treated with control (siCtrl: gray, n = 15), ALG-2 (siALG-2.1: blue, n = 18; siALG-2.4: light blue, n = 18), or AnxA11 (siAnxA11.1: green, n = 17; siAnxA11.2: yellow, n = 18) siRNAs from two independent experiments. The statistical significance of differences was analyzed by one-way ANOVA, followed by Tukey's test. Values with asterisks indicate a statistically significant difference from control (p < 0.05). C, confocal micrographs of siRNA-treated HT1080 cells stained with antibodies against ERGIC-53 and GM130. Cells transfected with indicated siRNAs were double-stained with antibodies against ERGIC-53 and GM130 as described in Fig. 3E. The right panel in each row shows merged images with the pseudocolors as follows: green (ERGIC-53) and magenta (GM130). Scale bar, 10 μm. D, quantitative analysis of ERGIC-53 distribution. The ratio of fluorescence intensity for ERGIC-53 in GM130-positive area to that in the whole cell in each cell transfected with the indicated siRNA was calculated. Values and bars represent relative mean values ± S.D. of cells treated with control (siCtrl: n = 19), ALG-2 (siALG-2.1: n = 20; siALG-2.4: n = 20) or AnxA11 (siAnxA11.1: n = 22; siAnxA11.2: n = 16) siRNAs. The statistical significance of differences was analyzed by one-way ANOVA, followed by Tukey's test. Values with asterisks indicate a statistically significant difference from control (p < 0.01). Representative data obtained from two independent experiments is shown.

