
FIGURE 4.
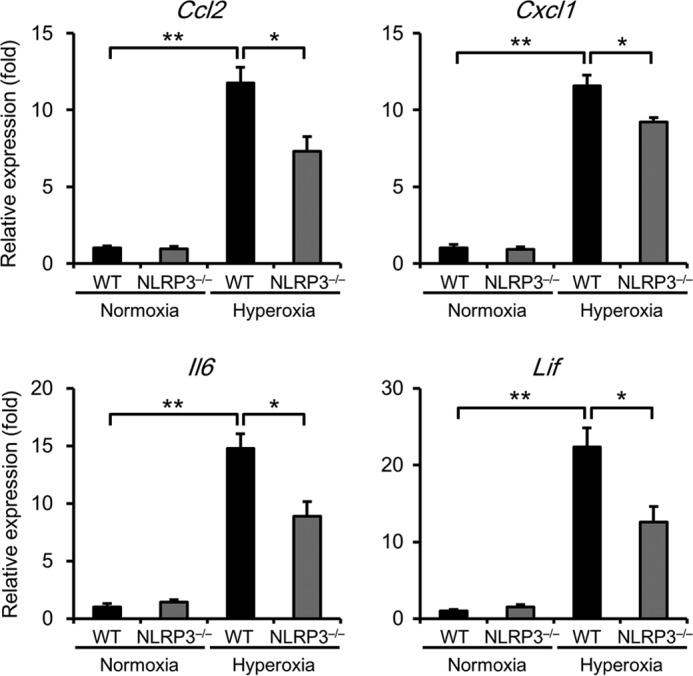
NLRP3−/− mice exhibit lower expression levels of Ccl2, Cxcl1, Il6, and Lif mRNAs. Lung samples were obtained from WT and NLRP3−/− mice exposed to normoxia or hyperoxia for 72 h. The lung mRNA levels of Ccl2, Cxcl1, Il6, and Lif were assessed by real-time RT-PCR analysis. Data are expressed as the means ± S.E. (normoxia, n = 6; hyperoxia, n = 6–12 for each). *, p < 0.05; **, p < 0.01.