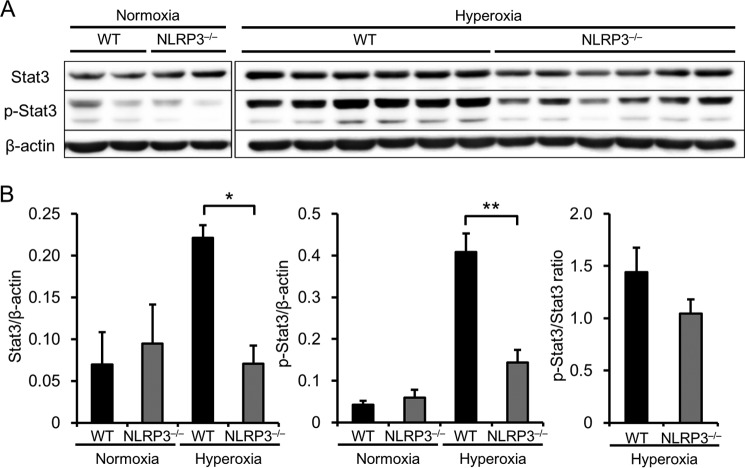
FIGURE 7.
NLRP3−/− mice exhibit lower levels of Stat3 expression and activation. Lung samples were obtained from WT and NLRP3−/− mice exposed to normoxia or hyperoxia for 72 h. A, Western blot analysis of Stat3 expression and activation in the lungs using antibodies against Stat3 and phospho-Stat3 (p-Stat3). B, quantitative analysis (n = 5–6 for each). Data are expressed as the means ± S.E. *, p < 0.05; **, p < 0.01.

