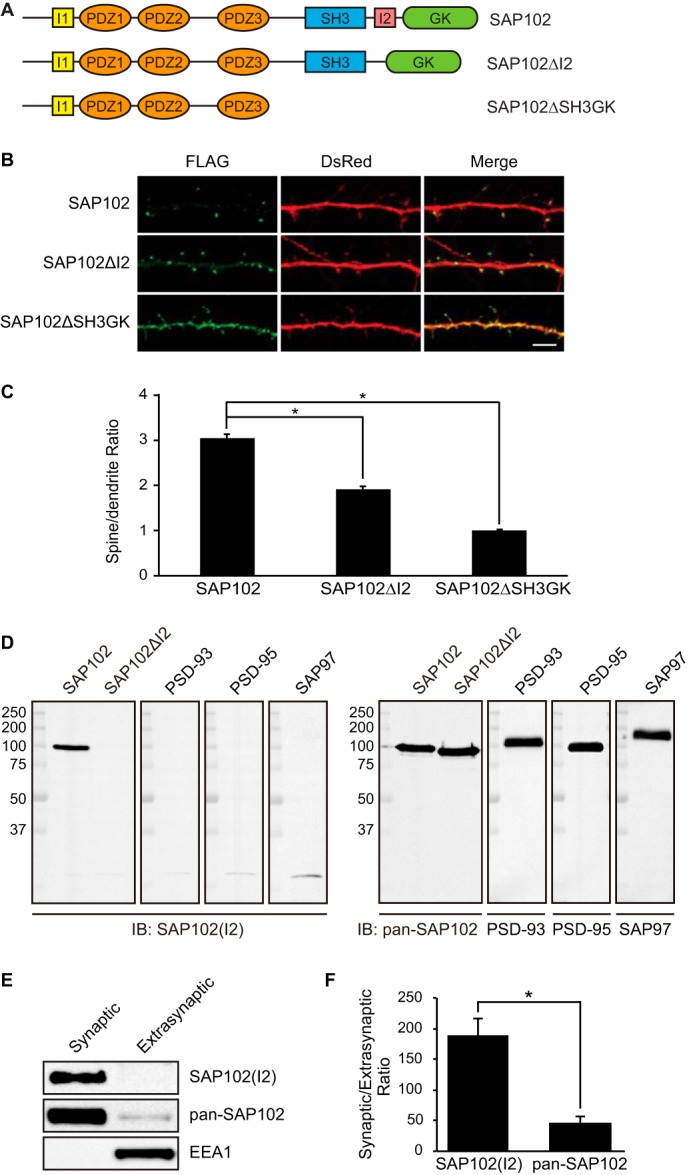
FIGURE 1.

The I2 region is important for SAP102 clustering in spines. A, schematic domain structures of two naturally occurring splice variants of SAP102 (SAP102 and SAP102 ΔI2) and a C-terminal truncated form used in this study. SAP102 contains both I1 and I2 regions. SAP102ΔI2 contains a 14-aa deletion of the I2 region between the SH3 and GK domains (14). B, hippocampal neurons were co-transfected with FLAG-SAP102/DsRed, FLAG-SAP102ΔI2/DsRed, or FLAG-SAP102ΔSH3GK/DsRed. SAP102ΔI2 displayed reduced synaptic targeting. FLAG-SAP102 is enriched in spines. FLAG-SAP102ΔSH3GK is uniformly distributed throughout the dendrite and the spines. Scale bar, 5 μm. C, the mean fluorescence intensity of spines compared with that in adjacent dendrites. The spine/dendrite green fluorescence ratio of FLAG-SAP102, FLAG-SAP102ΔI2, and FLAG-SAP102ΔSH3GK is 3 ± 0.09, 1.9 ± 0.05, and 0.98 ± 0.03, respectively. n = 10–15 neurons from three transfections. *, p < 0.05, t test with Bonferroni's correction after ANOVA. D, HEK-293 cells were transfected with SAP102, SAP102ΔI2, PSD-93, PSD-95, or SAP97, and immunoblots (IB) of cell lysate were probed with pan-SAP102, SAP102 I2-specific, PSD-93, PSD-95, or SAP97 antibody. E, distribution of proteins in synaptic and extrasynaptic membrane fractions. Equal amounts of total proteins were loaded from each of the fractions and probed with I2-specific SAP102 antibody, pan-SAP102 antibody (detects all SAP102 splice variants), and the early endosomal marker EEA1 antibody. F, ratio of synaptic to extrasynaptic membrane fractions of SAP102(I2) and total SAP102. Data represent the means ± S.E. The experiment was repeated three times and quantified using ImageQuant LAS TL software. *, p < 0.05, Student's t test.
