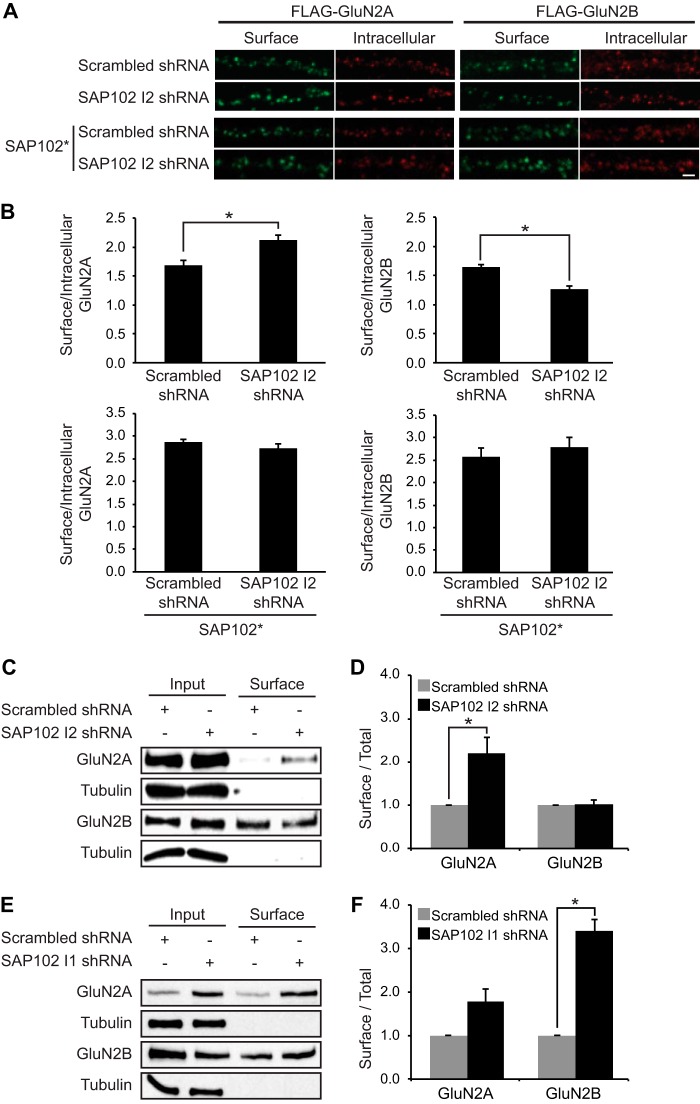
FIGURE 6.
Knock-down of I2-containing SAP102 increases surface expression of GluN2A. A, I2-containing SAP102 was knocked down in hippocampal cultures by the lentiviral induction of SAP102 I2 shRNA at DIV4, and FLAG-tagged GluN2A or GluN2B was transfected at DIV12. B, co-transfection of FLAG-tagged GluN2A or GluN2B with an shRNA-proofed Myc-tagged SAP102 variant (SAP102*). Surface staining was performed at DIV14 with anti-FLAG and Alexa 647 secondary antibodies (green), and after permeabilization, the intracellular pool was labeled with anti-FLAG and Alexa 568 secondary antibodies (red). Scale bar, 2 μm. B, quantification of the imaging experiments. Fluorescence intensities were measured using ImageJ software. Data represent the means ± S.E. (n = 27; n = 3 independent experiments); *, p < 0.05, Student's t test. C, biotinylated surface proteins from cortical neurons infected with lentivirus containing scrambled or SAP102 I2 shRNA were isolated, resolved by SDS-PAGE, and probed with GluN2A, GluN2B, or α-tubulin antibodies. D, quantification of the biotinylation experiments. The immunoreactive signals for surface GluN2A and GluN2B were normalized to total input and presented as a bar graph. n = 3 independent experiments. Data represent the mean ± S.E.; *, p < 0.05, Student's t test. E, biotinylated surface proteins from cortical neurons infected with lentivirus containing scrambled or SAP102 I1 shRNA were isolated, resolved by SDS-PAGE, and probed with GluN2A, GluN2B, or α-tubulin antibodies. F, quantification of the biotinylation experiments. The immune-reactive signals for surface GluN2A and GluN2B were normalized to total input and presented as a bar graph. n = 3 independent experiments. Data represent the means ± S.E.; *, p < 0.05, Student's t test.

