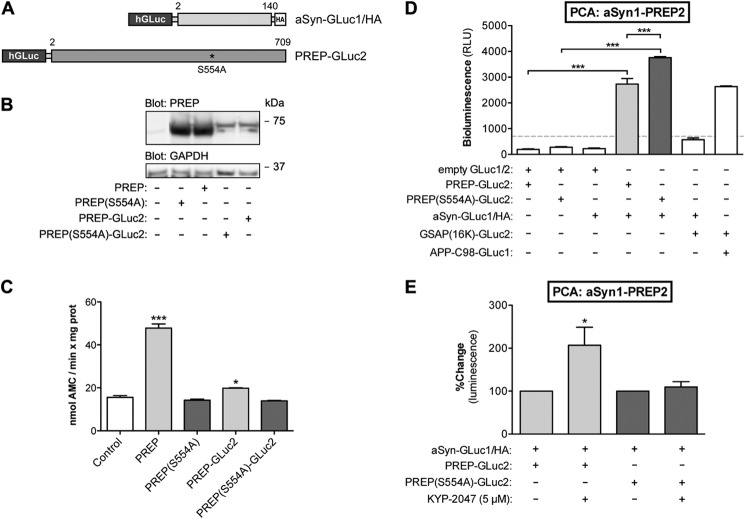
FIGURE 3.
aSyn interacts with PREP and PREP(S554A) in live cells. A, schematic presentation of GLuc fragment-tagged reporter constructs of aSyn and PREP used in this study. B, PREP protein expression after different construct transfections was studied by Western blot. All the constructs showed PREP protein expression, although PREP-GLuc2 was expressed at a lower level as compared with untagged PREP. Blot was stained with antibodies to PREP and GAPDH as a loading control. C, the enzymatic activity of PREP and PREP-GLuc2 was studied by an enzyme assay using a fluorescent substrate peptide. PREP activity in N2A cell lysates was significantly increased by PREP and PREP-GLuc2 transfections (one-way ANOVA; ***, p < 0.001 PREP versus control; *, p < 0.05 PREP-GLuc2 versus control), whereas cells transfected with PREP(S554A) or PREP(S554A)-GLuc2 did not show any enzymatic activity. D, the interaction of aSyn-GLuc1 with PREP-GLuc2 and PREP(S554A)-GLuc2 was studied by PCA. To confirm interaction specificity, the following reporter plasmids were co-expressed in pairs (62.5 ng each): PREP-GLuc2 with GLuc1 (“empty” plasmid, no insert), PREP(S554A)-GLuc2 with GLuc1, aSyn-GLuc1 with GLuc2, aSyn-GLuc1 with GSAP(16k)-GLuc2, APPC98-GLuc1 with GSAP(16k)-GLuc2. To demonstrate the aSyn-PREP interaction, aSyn-GLuc1 was co-expressed with PREP-GLuc2 or PREP(S554A)-GLuc2 (62.5 ng each). Both PREP-GLuc2 and PREP(S554A)-GLuc2 showed a significant PCA signal with aSyn-GLuc1 (one-way ANOVA; ***, p < 0.001), and interestingly, PREP(S554A)-GLuc2 had even stronger interaction with aSyn-GLuc1 than active PREP (one-way ANOVA; ***, p < 0.001). The average values are displayed as direct luminescence readout. Signals below 700 relative luminescence units (RLU) were regarded as background noise (mean ± S.E.; n = 3 independent experiments). E, the effect of KYP-2047 on aSyn-PREP and aSyn-PREP(S554A) interaction was studied by PCA. The same transfections were used as in Fig. 3B, but in addition the cells were treated with 5 μm KYP-2047 for 4 h. KYP-2047 showed a significant increase in the PCA signal of PREP-GLuc2 and aSyn-GLuc2 (one-way ANOVA; *, p < 0.05), but not with inactive PREP(S554A). DMSO was used as vehicle control. The average values are displayed as percent change as compared with the individual controls for aSyn-PREP and aSyn-PREP(S554A), respectively (mean ± S.E.; n = 3 independent experiments).

