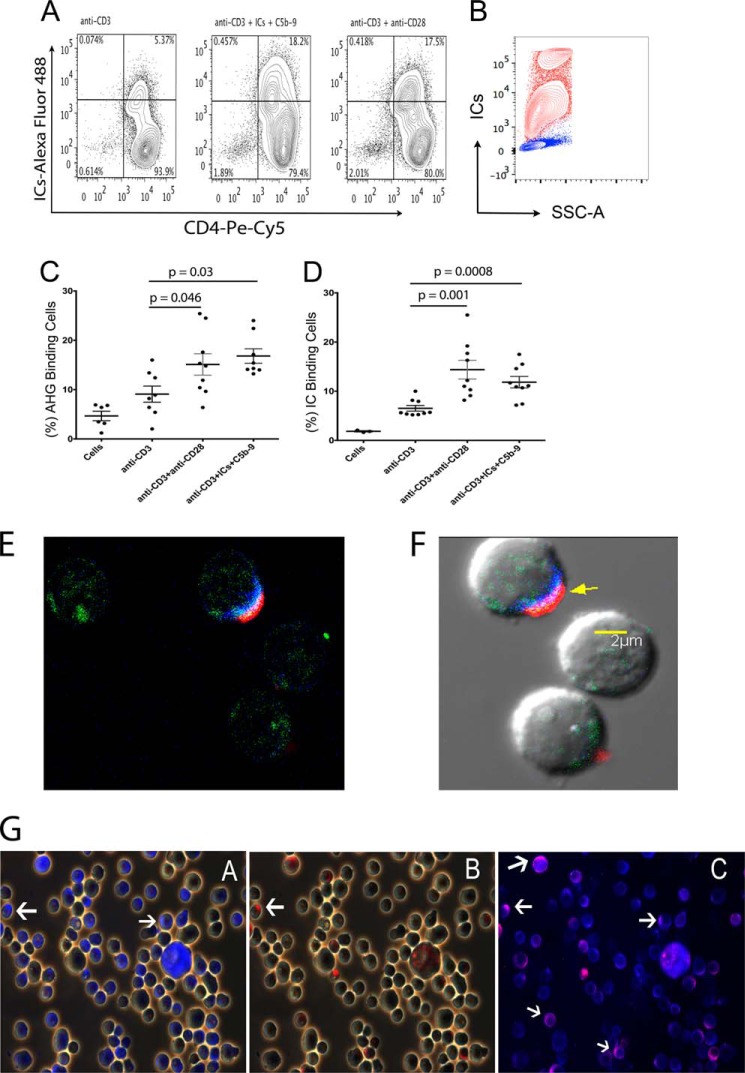
FIGURE 1.
Activated CD4+ T-cells bind to AHG and ICs. Flow cytometry analysis for Alexa-488-labeled AHG and ICs binding to activated naïve CD4+ T-cells. A, cells activated in a donor with anti-CD3+anti-CD28 (17.5%) or anti-CD3+ICs+C5b-9 (18.2%) showed enhanced binding for ICs compared with cells treated with anti-CD3 (5.37%). B, THP-1 cells bound labeled ICs (red), unstained control (blue). C, binding of AHG to cells treated with anti-CD3+anti-CD28 showed statistically significant increase at a p value of 0.046, and treated with anti-CD3+ICs+C5b-9 at a p value of 0.03 compared with anti-CD3-treated cells, n = 8. D, binding of labeled IC to anti-CD3+anti-CD28 treated cells showed a statistically significant increase at a p value of 0.001 and in anti-CD3+ICs+C5b-9-treated cells at a p value of 0.0008 versus anti-CD3 treatment (n = 9). E and F, confocal image of a cell without and with DIC background, stained for IC-Alexa Fluor® 488 (green), anti-FcγRIIIa/b monoclonal-Alexa Fluor® 405 (blue), and anti-FcγRIIIb polyclonal-Alexa Fluor® 594 (red), (630× magnification). G, activated CD4+ T-cells stained using anti-FcγRIIIa/b monoclonal-Alexa Fluor 405 (blue) and co-stained with anti-FcγRIIIb polyclonal-Alexa Fluor® 594 (red). White arrows point to blue and red stain. Cells demonstrated staining for both receptors (magnification 400×).

