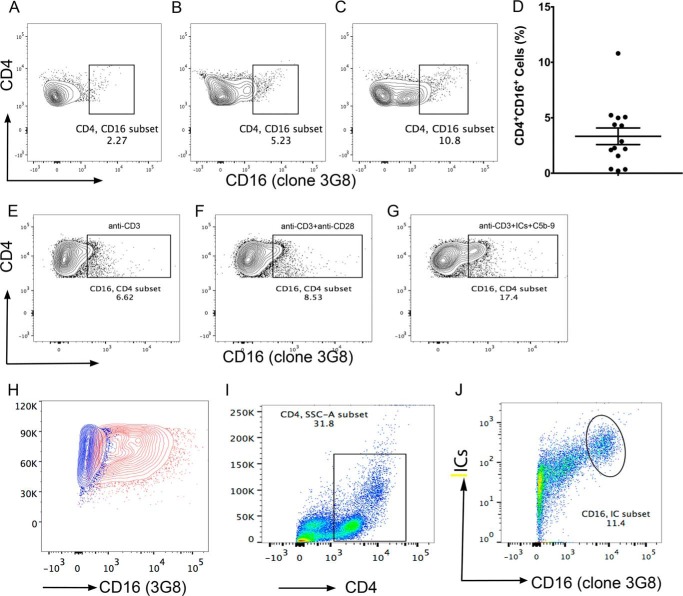
FIGURE 2.
A subset of CD4+ cells in PBMC binds to anti-CD16 (clone 3G8). Flow analysis showed varied amount of cells bound to anti-CD16. CD16 expression shown in three donors (A) (2.27%); (B) (5.23%), and (C) (10.8%). A total of 14 subjects were analyzed in four separate experiments (D), combined analysis show 3.33 ± 0.748% (mean ± S.E.) cells bound to anti-CD16. Purified CD4+CD45RA+ T-cells stained with anti-CD16-PE on day 8 postactivation. Anti-CD3+ICs+C5b-9-treated cells showed ∼3-fold increase in anti-CD16 binding (G) compared with anti-CD3 (E). A small increase in anti-CD3+anti-CD28 was also observed. THP-1 cells stained with anti-CD16 (red) and unstained control (blue) (H) CD4+ gated PBMC (I) CD4+ T-cells from PBMC show double staining for ICs-Alexa Fluor 488 and anti-CD16-PE (J) (shown 1/3 analyzed).

