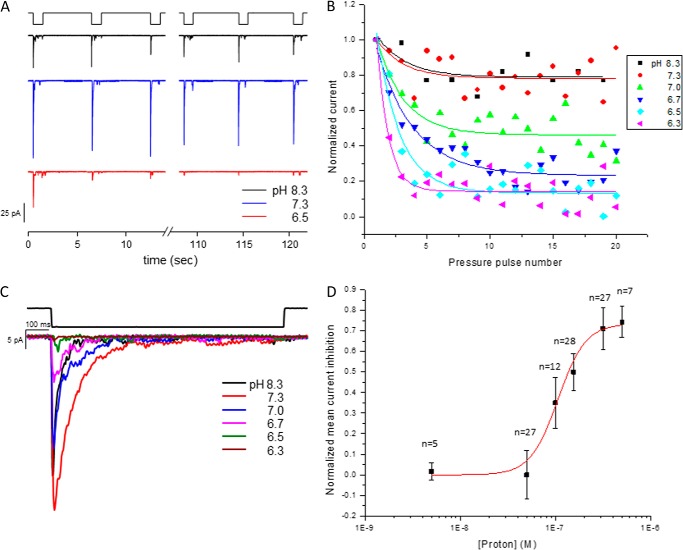
FIGURE 1.
PIEZO1 activity at different pH values in cell-attached mode. HEK293 cells were transfected with a plasmid containing the human PIEZO1 gene, and the cells were tested 24–48 h later. A shows the time course of currents elicited by a negative-pressure pulse train of −30 mm Hg at −80 mV at the indicated pH in the pipette. The suction pulses were 1 s long, followed 5 s of rest. At pH 6.5, there was a significant loss of activity within the first few pulses, and this was not observed at higher pH. B is a plot of the mean peak current from multiple patches with six different pH solutions ranging from pH 6.3 to 8.3. The normalized peak current decay was used to determine the steady-state current. C is a plot of the current for each pH at a membrane voltage of −80 mV and suction of −30 mm Hg. D is the pH profile (titration) for PIEZO1 inhibition derived from the peak currents plotted in C. The data were fit to a Hill plot with a midpoint pH of 6.9 ± 0.8 and n = 3 ± 1 (R2 = 0.98).

