
FIGURE 2.
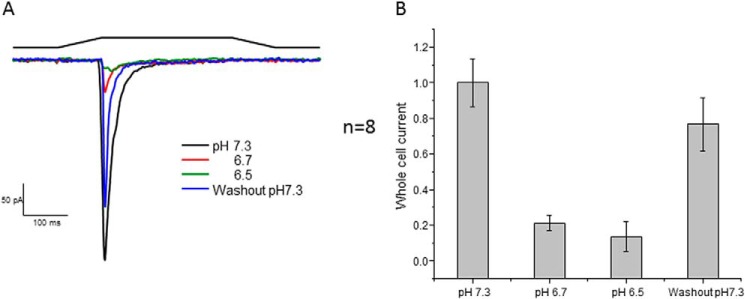
Whole-cell PIEZO1 currents generated at the indicated pH. The stimulus was indentation of the cell by a fire-polished pipette. To change the pH of the cell, we perfused it with the perfusion outlet positioned near the cell. A shows current traces with the stimulus pulses shown above. Returning to the control pH of 7.3 recovered most of the activity. B shows quantification of the change in peak current resulting from the change in pH with the S.D. (membrane potential of −60 mV).