
FIGURE 4.
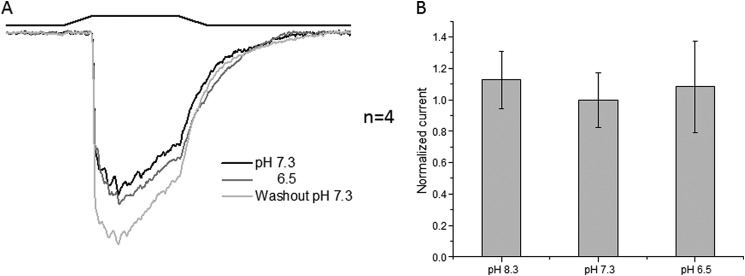
Whole-cell recordings of the non-inactivating form of PIEZO1 perfuse at the indicated pH. A shows the average peak response. Note that the rundown kinetics were no longer sensitive to pH. B shows the average peak response with the S.D. (membrane potential of −60 mV).