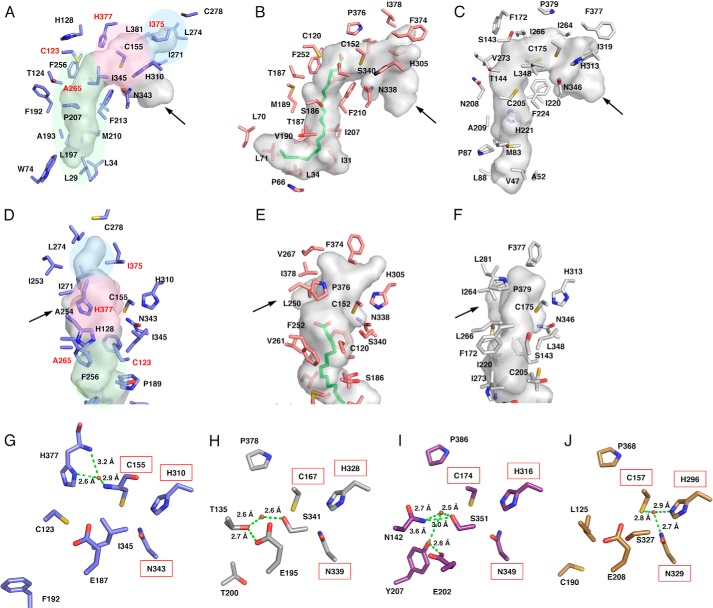
FIGURE 4.
Comparison of the active site structures of A. oryzae CsyB and other type III PKSs. A–C, comparison of the active site cavity of A. oryzae CsyB (A), N. crassa ORAS (B), and M. tuberculosis PKS18 (C). The C16 fatty acid molecule in N. crassa ORAS is shown as a green stick model. D–F, close-up views of the novel pocket of A. oryzae CsyB (D) and corresponding regions of N. crassa ORAS (E) and M. tuberculosis PKS18 (F). The arrows indicate the entrance of cavity. The elongation/cyclization pocket, the downward expanding hydrophobic tunnel, and the CsyB-specific novel pocket described under “Results” are colored pink, green, and blue, respectively. The residues mutated in this study are labeled in red. G–J, close-up views of the electronic hydrogen bond networks of A. oryzae CsyB (G), P. sylvestris stilbene synthase (H), O. sativa CUS (I), and R. palmatum benzalacetone synthase (J). Catalytic residues are highlighted by a red square. The water molecules and the hydrogen bonds are indicated with red spheres and green dotted lines, respectively.

