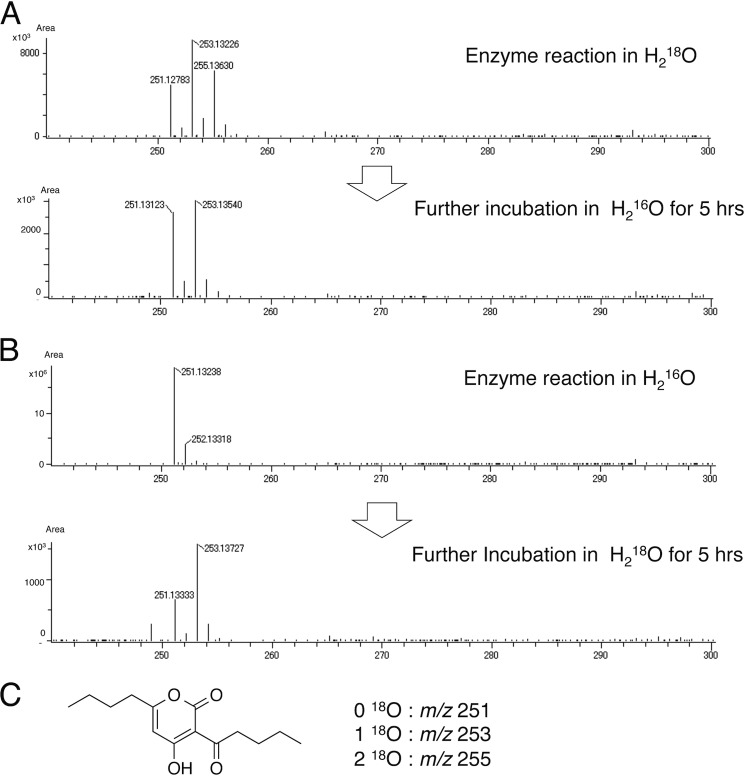
FIGURE 8.
Comparisons of HR-ESI-MS spectra. A, 3b produced by CsyB in 80% H218O and the products of further incubation with 18O-labeled 3b in H216O without enzyme. B, 3b produced by CsyB in H216O and the products of further incubation with non-labeled 3b in H218O without enzyme. C, the structure of 3b and m/z of 18O-incorporated 3b.

