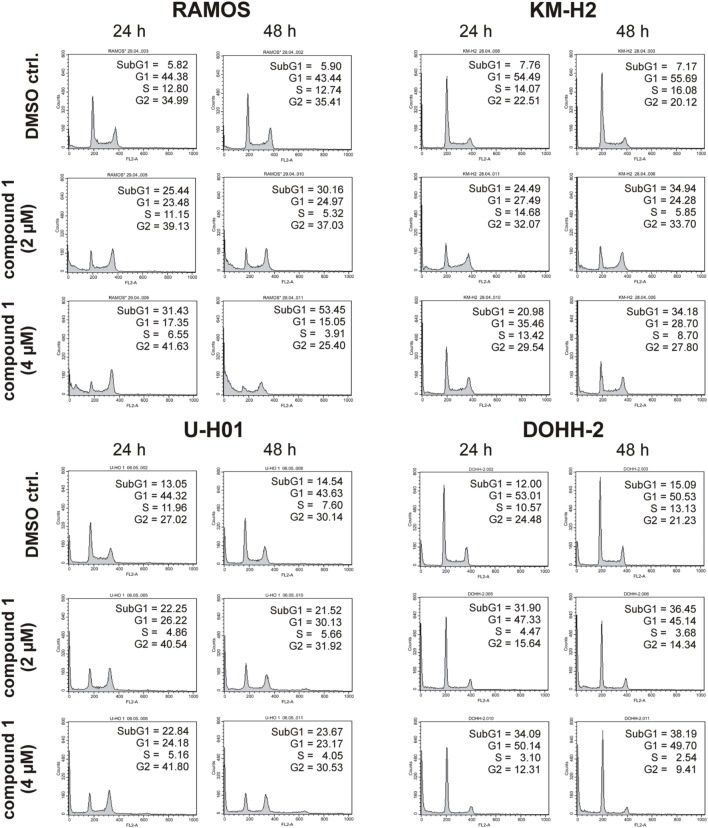
Figure 5.
Cell cycle analyses of RAMOS, KM-H2, U-H01, and DOHH-2 cells after treatment with the CK1δ-specific inhibitor compound 1. Cells were treated with different concentrations of compound 1 for 24 h and 48 h and stained with propidium iodide in order to perform cell cycle analysis as described in Material and Methods. DMSO treated cells served as control. Each 20.000 cells in two replicates per condition were counted. One representative graph is shown. The determined fractions of cells in various phases of the cell cycle are given as percent values (%). Flow cytometry plots show the number of cells (y-axis) with each observed intensity of propidium iodide DNA staining (x-axis). DMSO treated cells showed a normal cell cycle distribution of asynchronously proliferating cells. Treatment with compound 1 led to an increase of RAMOS, KM-H2, and U-H01 cells in G2 phase. Additionally, RAMOS cells accumulate in Sub G1 phase as well. No obvious effects could be observed in DOHH-2 cells.

