Figure 3.

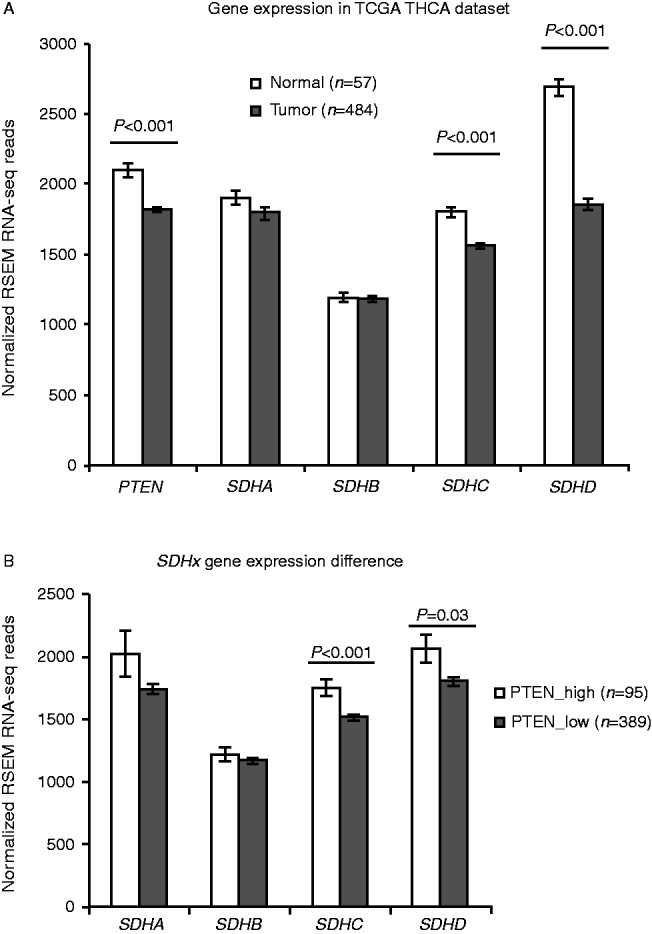
PTEN and SDHx gene expression in TCGA THCA dataset. (A) PTEN and SDHx gene expression in tumor samples compared with normal samples; (B) SDHx gene expression differences in high PTEN expression tumor group compared with low PTEN expression tumor group. P value was obtained using two-tailed Student's t-test.

 This work is licensed under a