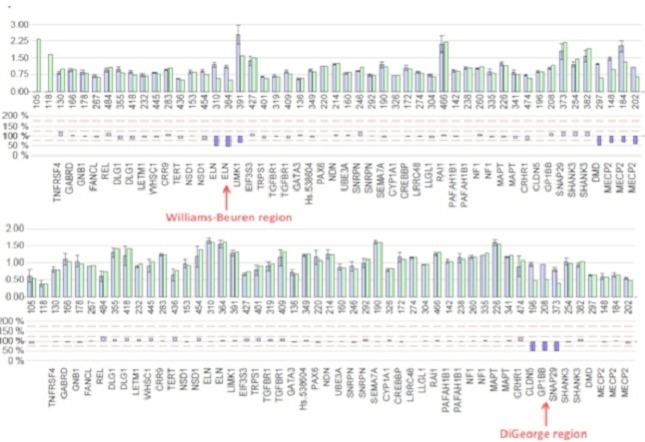
Figure 2.

MLPA results. On the above chart, the red arrow shows deletion of two probes ELN and LIMK1 involved in Williams-Beuren syndrome (microdeletion 7q11.23), whereas the red arrow on the below figure shows the deletion of three probes, i.e. CLDN5, GP1BB and SNAP29 involved in DiGeorge syndrome
