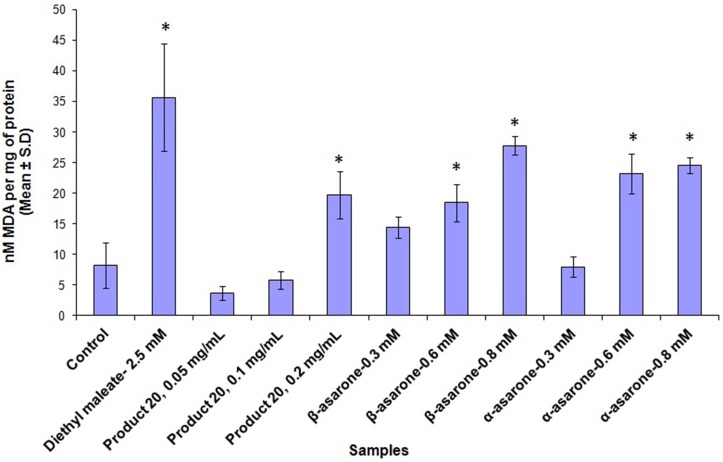
Figure 3.
The plot shows the average nanomoles of MDA per mg of protein ± standard deviation of three independent experiments upon treatment with methanol extracts of Product 20, α and β-asarones against THLE-2 cells for 24 h. Significant difference (*) was taken as p < 0.05 in comparison with untreated control cells.

