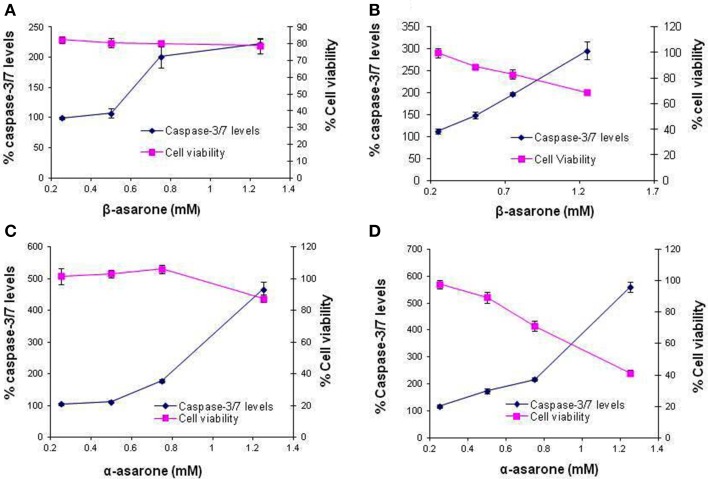
Figure 5.
Effects on caspase-3/7 activation and cell viability after treatment with (A) β-asarone for 6 h, (B) β-asarone for 12 h, (C) α-asarone for 6 h and (D) α-asarone for 12 h. The plot represents average % caspase-3/7 levels on primary Y-axis and % cell viability on secondary Y-axis ± standard deviation at different concentrations.

