Figure 5.
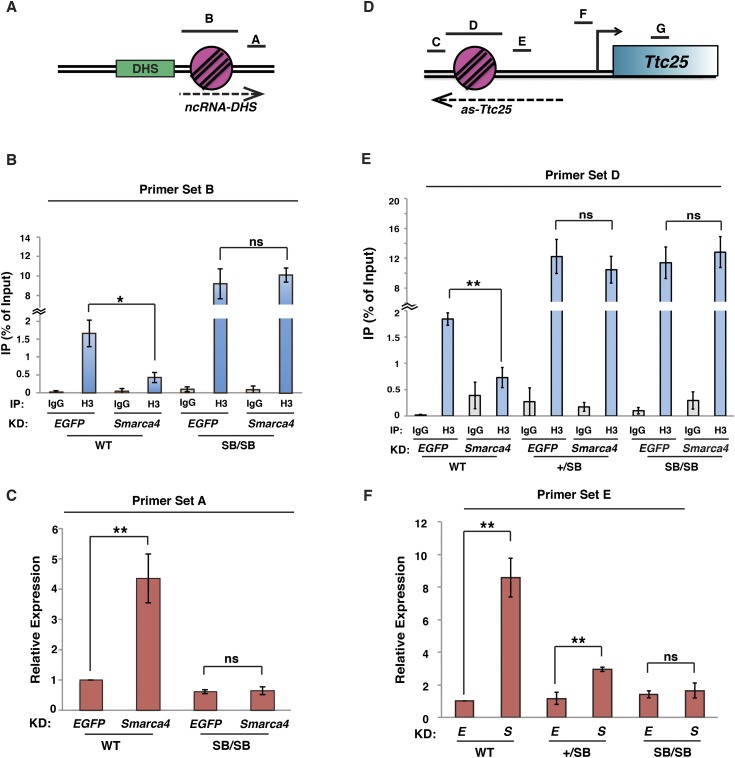
esBAF silences ncRNA expression by increasing nucleosome occupancy adjacent to NDRs. (A) Diagram of the DHS-chr2 locus with qPCR amplicons depicted. (B) Histone H3 ChIP-qPCR over the −1 nucleosome in wild-type (WT) or nucleosome SB homozygote (SB/SB) lines upon either EGFP knockdown (KD) or Smarca4 knockdown. H3 levels are expressed as a fraction of the input. Shown are the mean ± SD values of three biological replicates. (C) Randomly primed RT-qPCR of DHS transcripts in EGFP knockdown or Smarca4 knockdown cells. Expression levels were normalized to GAPDH and are shown relative to wild-type EGFP knockdown. Shown are the mean ± SD values of three biological replicates. (D) Diagram of the Ttc25 locus with qPCR amplicons depicted. (E) Histone H3 ChIP-qPCR over the −1 nucleosome in wild-type, SB heterozygote (+/SB), or SB/SB lines upon either EGFP knockdown or Smarca4 knockdown. Data are depicted as in B. (F) Randomly primed RT-qPCR of antisense transcripts in EGFP knockdown (E) or Smarca4 knockdown (S) cells, as in C. Statistical significance of alterations in expression or occupancy is indicated. (*) P < 0.05; (**) P < 0.01; (ns) not significant.

