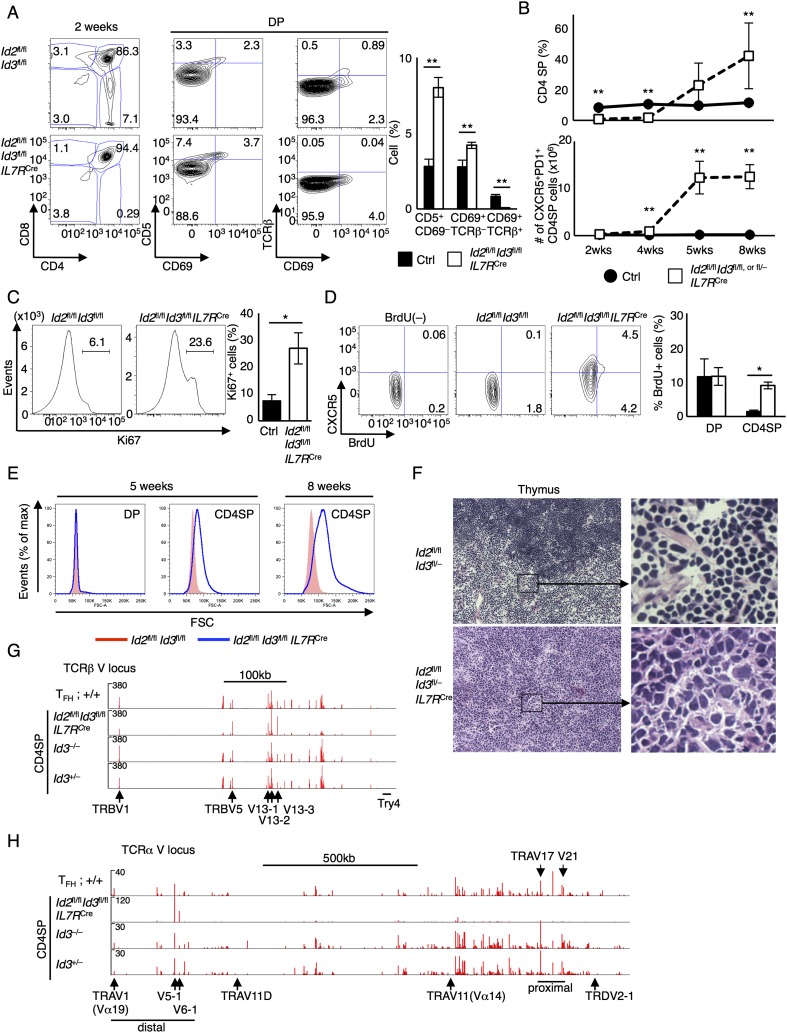
Figure 3.
An expanding population of CXCR5+ cells in thymi derived from Id2fl/flId3fl/flIL7RCre mice. (A) Flow cytometric analysis of CD4 versus CD8 expression in total thymocytes and CD69 versus CD5 expression and CD69 versus TCRβ expression gated on DP cells derived from 2-wk-old Id2fl/flId3fl/flIL7RCre or littermate control mice. The graph shows the frequency of CD5+CD69−, CD69+TCRβ−, and CD69+TCRβ+ cells in the DP compartment. Numbers adjacent to the outlined areas or in quadrants indicate the percentages of cells in the population. Data are representative of one experiment with 2-wk-old mice (mean ± SD; n = 5 [Ctrl] and 3 [Id2fl/flId3fl/flIL7RCre] biological replicates). (B) The frequency of CD4SP cells (top) and the number of CXCR5+PD-1+ CD4SP cells (bottom) are plotted. Data were derived from five independent experiments (mean ± SD; n = 5 or 3 [2-wk], 3 [4-wk], and 4 [5- or 8-wk] biological replicates). (C) Intracellular staining of Ki67 in CD4SP cells derived from 8-wk-old Id2fl/flId3fl/flIL7RCre or littermate control mice. Numbers above lines indicate percentages of Ki67-expressing cells. The graph shows the frequency of Ki67-expressing cells derived from 6- to 8-wk-old Id2fl/flId3fl/flIL7RCre or littermate control mice. Data were derived from two independent experiments (mean ± SD; n = 4 biological replicates). (D) Flow cytometric analysis of BrdU incorporation and CXCR5 expression gated on CD4SP (TCRβ+CD25−) cells derived from 8-wk-old Id2fl/flId3fl/flIL7RCre or littermate control mice. Mice were injected intraperitoneally with 1 mg of PBS (BrdU−) or BrdU twice (24 h and 2 h prior to harvesting). Numbers in quadrants indicate BrdU-incorporated cells. The graph shows the frequency of BrdU+ cells in DP and CD4SP cells. Data were derived from two independent experiments (mean ± SD; n = 4 biological replicates). (E) Flow cytometric analysis of cell size (FSC) in DP and CD4SP cells derived from 5- or 8-wk-old Id2fl/flId3fl/flIL7RCre or littermate control mice. Data were derived from two (5-wk) or four (8-wk) independent experiments. (F) Representative hematoxylin and eosin (H&E) staining of thymi derived from 6-mo-old Id2fl/flId3fl/flIL7RCre or littermate control mice. Original magnification, 200×. Data are representative of three independent experiments. (G,H) RNA-seq data for the TCRα V locus (H) and TCRβ V locus (G). mRNA was isolated from sorted CXCR5+CD44hi CD4 T cells from SRBC-immunized wild-type spleens (TFH) and CD4SP thymocytes derived from 8-wk-old Id2fl/flId3fl/flIL7RCre, Id3−/−, and Id3+/− thymi and analyzed using RNA-seq. Numbers of reads are indicated for each of the tracks. (G,H) Two independent experiments with three mice each. (*) P < 0.05; (**) P < 0.01 (Student’s t-test).

