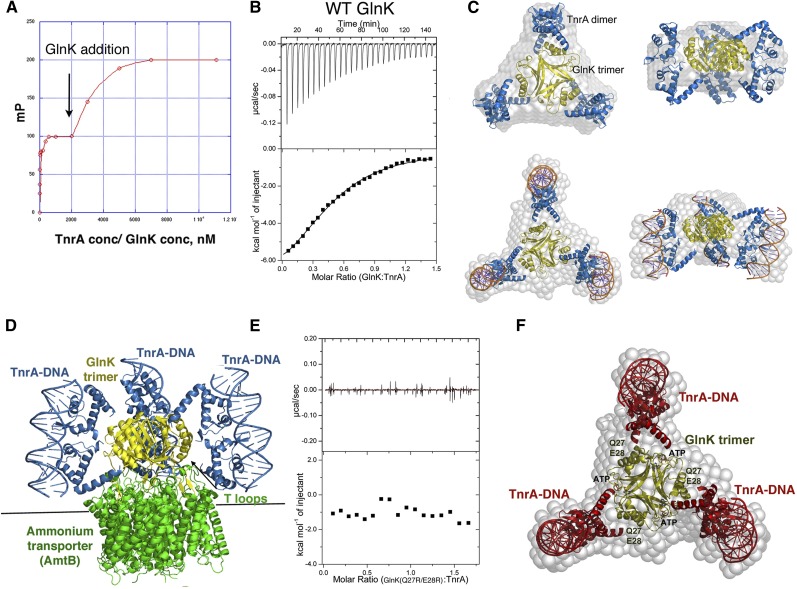
Figure 4.
Characterization of the TnrA–GlnK interaction. (A) FP analysis of GlnK binding to a preformed TnrA–DNA complex. TnrA–DNA complex formation is represented by the first binding event. Subsequent addition of GlnK leads to a second, saturable binding curve. (B) ITC analysis of the TnrA–GlnK interaction. The binding isotherm reveals a binding stoichiometry of two TnrA subunits (TnrA dimer):one GlnK subunit. (C) SAXS analyses of GlnK–TnrA and GlnK–TnrA–DNA complexes. Shown are the SAXS envelopes (gray) with docked GlnK (yellow) and TnrA (blue). The DNA is shown as sticks for the GlnK–TnrA–DNA complex. (D) Model of the GlnK–AmtB–TnrA–DNA quaternary complex constructed using the structure of GlnK–AmtB and the GlnK–TnrA–DNA SAXS model. (E) ITC analysis of the GlnK(Q27R/E28R) mutant showing no binding to TnrA. (F) SAXS GlnK–TnrA model, with the locations of the GlnK(Q27R/E28R) mutations and ATP, which disrupt TnrA binding by overlapping with its binding site, labeled.

