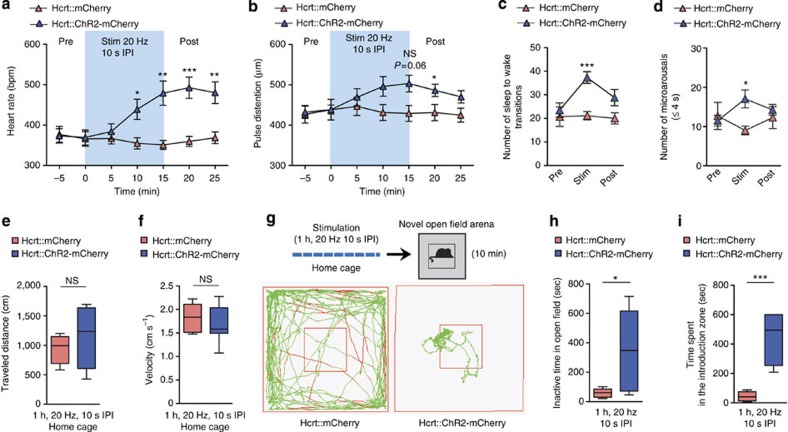
Figure 2. Long stimulation of Hcrt neurons induces a generalized state of stress.
(a,b) Photostimulation at 20 Hz (10 s pulse, 10 s IPI) of Hcrt neurons in ChR2 mice (blue, n=6) causes an elevation of heart rate (a) and pulse distention (b), as an indicator of blood pressure, without affecting control mice (red, n=7). ***P<0.001 **P<0.01, *P<0.05 (a,b). (c,d) Persistent optogenetic stimulation of Hcrt neurons enhances sleep fragmentation characterized by increased sleep-to-wake transitions (c) and microarousal events (d). Sleep–wake parameters were recorded and averaged over 1 h before (Pre), during (Stim) and 1 h after (Post) Hcrt photostimulation in ChR2 (blue, n=9) and control mice (red, n=7). ***P<0.001 (c), *P<0.05 (d). (e–f) Hcrt photostimulation at 20 Hz does not modify home-cage locomotor activity. Bar graphs indicate total distance travelled (e) and average velocity (f) in ChR2 (blue, n=7) and control mice (red, n=5). P=0.37 (e) and P=0.54 (f), two-tailed unpaired Student’s t-test between transduced mice. (g–i) Hcrt-stimulated ChR2 mice failed to exhibit forward locomotor activity in new open field behavioural assay. (g) Diagrams show representative profile of mice activity in new open field. Green lines represent travel pattern and red lines indicate rapid activity (≥25 cm s−1). Red square indicates the introduction centre zone. (h,i) Stimulated ChR2 mice (blue, n=5) exhibit reduced field exploration measured by increased inactive time (h) and time spent in the introduction centre zone (i) compared with controls (red, n=6). *P<0.05 (h), and ***P<0.001 (i), two-tailed unpaired Student’s t-test between transduced mice. ‡Two-way repeated measures ANOVA between viral transduction and time epochs or stimulation condition. §One-way repeated measures ANOVA followed by Tukey’s post-hoc test. NS, not significant (P≥0.05). Connected triangles in a–d represent mean±s.e.m. In e–i, centre lines show the median, boxes extend from 25th to 75th percentiles, whiskers indicate minimum and maximum values.

