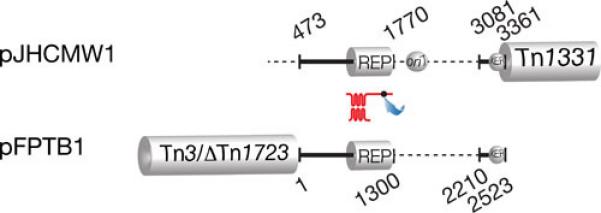
Fig. 2.

Comparison of pFPBT1 and pJHCMW1. The black lines, which represent regions of homology (coordinates 463-3361 in pJHCMW1), are drawn at scale. The Tn3-like transposons, Tn1331 and Tn3/DeltaTn1723, as well as the dots indicating oriT and the Xer target sites are shown at the correct locations but are not drawn to scale. The replication regions (REP) share 97% homology. The numbers indicate the coordinates in the GenBank database (pJHCMW1, accession number AF479774; pFPBT1, accession number AJ634602). The location of the similar but not identical Xer site-specific recombination sites (81) is indicated.
