
Figure 1.
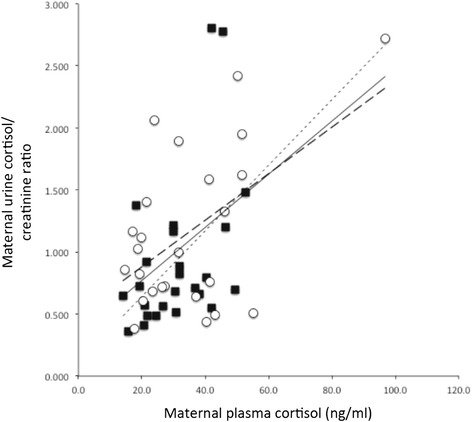
Correlation of maternal plasma cortisol and urine cortisol between depressed and non-depressed pregnant women. Trend line for all study subjects is the solid black line (r2 = 0.25, p < 0.001). Trend line for the depressed subjects only (closed symbols) is the fine dashed line (r2 = 0.22, p < 0.02), and the trend line for the non-depressed subjects only (open symbols) is the heavy dashed line (r2 = 0.28, p < 0.01).