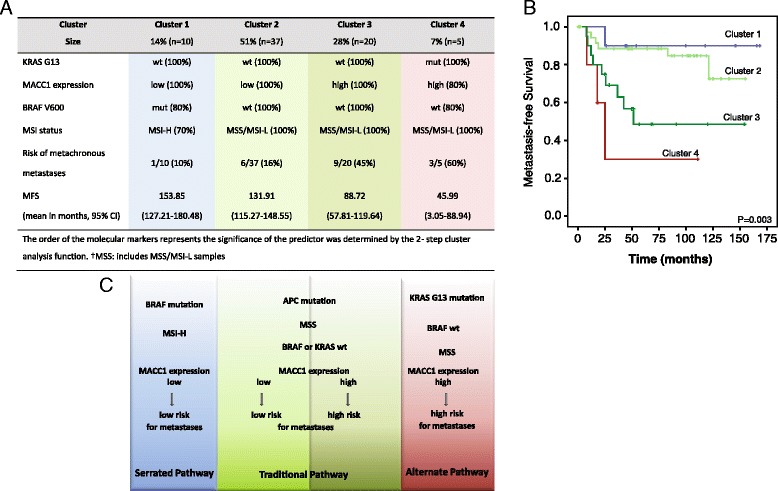
Figure 3.

Classification of CRC patients with regard to their molecular characterization. A Integrative 2-step cluster analyses allowed the differentiation of four clusters with regard to their tumor characteristics. Clustering of the tumors concerning KRAS G13 mutation, MACC1 expression, BRAF V600 mutation and MSI status was performed by the SPSS 2-step cluster function. The order of the molecular markers represents the significance of the predictor was determined by the 2- step cluster analysis function. †MSS: includes MSS/MSI-L samples. B Kaplan-Meier survival analysis revealed significantly different survival times for the four clusters (P = 0.003). Patients of Cluster 1 had the best prognosis and patients in Cluster 4 had the worst prognosis. C According to Leggett and Whitehall [2] Cluster 1 (in blue) represents the “Serrated pathway” which is characterized by the lowest risk (10%) for metastasis formation. Cluster 2 and Cluster 3 belong to the “Traditional pathway” (in green) with intermediate risk for metastasis formation. Here, we show that MACC1 expression subdivides this cluster into a low risk (16%, light green) and high risk (45%, dark green) group. The highest risk (60%) patients were classified in Cluster 4 representing the “Alternate pathway” (in red). According to our results these tumors are now characterized by a high MACC1 expression and mutated KRAS G13.
