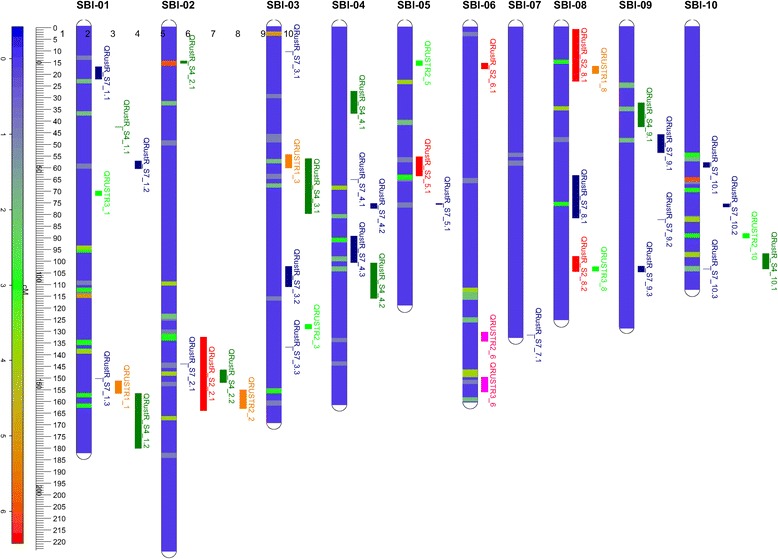
Figure 1.

Rust resistance QTL from the current study projected onto the sorghum consensus genetic linkage map in comparison with rust QTL identified in previous studies. The bars to the right of each chromosome indicate rust resistance QTL identified, colour-coded as follows: red: S2 (current study); dark green: S4 (current study); dark blue: S7 (current study); green: [3]; orange; [5]; pink: [7]. The locations of the QTL identified in the AYT association mapping set are represented by a separate heat map, for each LG, detailing QTL density (number of QTL/0.5 cM).
