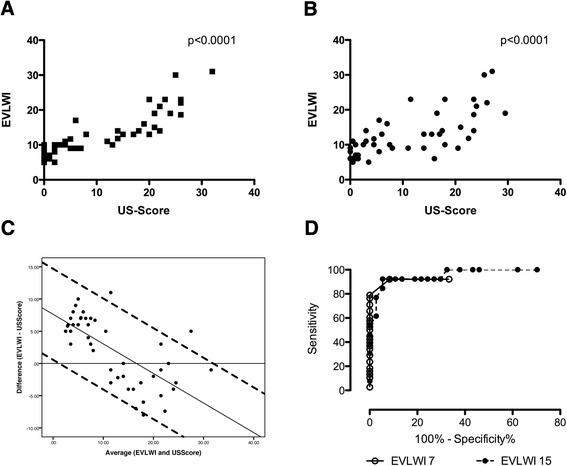
Figure 3.

Correlation of the extravascular lung water index with the ultrasound score. (A) We found a close correlation of the ultrasound (US) score with the extravascular lung water index (EVLWI) (Spearman’s r = 0.91, P < 0.0001). (B) Correlation of the blinded US score as a mean of two independent examiners is shown (Spearman’s r = 0.72, P < 0.0001). (C) Bland-Altman plot comparing the difference (EVLWI − US score) with the average (of EVLWI and US score). Additionally, a linear regression (difference = 7.62 − 0.46 × average) and the 95% confident intervals (linear regression ± 1.96 × 3.6) are plotted. (D) Receiver operating characteristic curves of the US score obtained to identify patients with EVLWIs >7 and >15 show excellent diagnostic performance, as indicated by the areas under the curve of 0.9419 and 0.9636.
