
Figure 3.
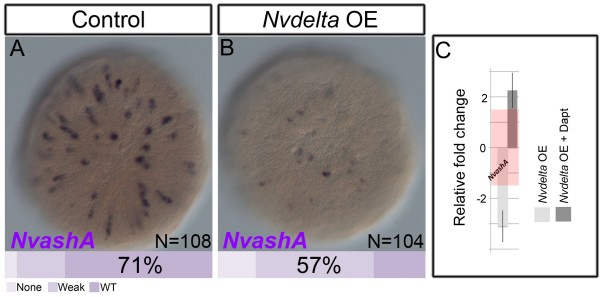
Nvdelta activates Nvnotch activity to suppress NvashA. (A-B) Shown are Aboral views of NvashA expression in control (A) and Nvdelta overexpressing (OE) (B) animals. Phenotypic classes were scored as no expression, weak, wild-type (WT) levels, and strong expression. The key is shown in the image and bars at the base of each image represent the percentage of animals in each phenotypic class. (C) Relative fold change of NvashA and previously identified Nvasha neural gene targets and in animals overexpressing Nvdelta (light grey bars) and animals that are overexpressing Nvdelta and treated with DAPT (dark grey bars). Red rectangle denotes relative fold change −1.5 to 1.5, which corresponds to no change in relative expression.