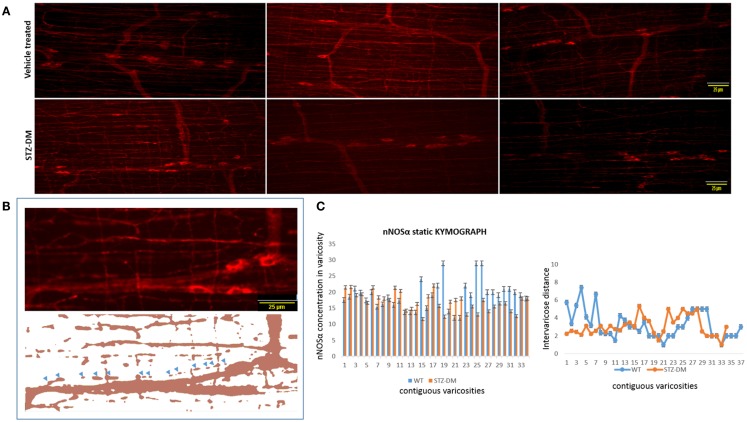
Figure 10.
Comparative levels of expression of nNOSα in nerve terminals of both wild type and diabetic tissues (A). Upper panel shows variance in appearance of nNOSα in vehicle treated and diabetes. Comparative quantitation demonstrated similar nNOSα levels within varicosities. (B) Fluorescent images were thresholded to digitally isolate individual nitrergic varicosities. Varicosity areas were estimated with ImageJ. nNOSα fluorescent intensities within varicosities were estimated with unaltered images. (C) nNOSα static kymograph shows normal axonal transport of nNOSα in diabetic jejunum to the farthest varicosities. Intervaricose distances were comparable between groups. Scale bar, 25 μm.

