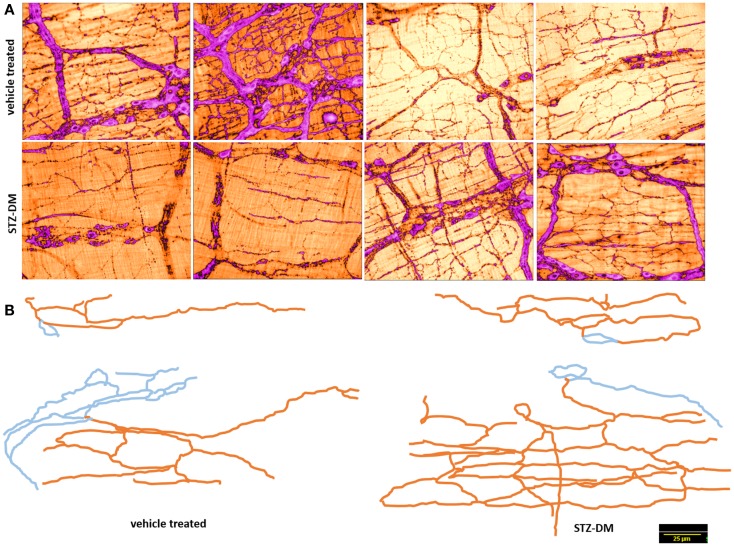
Figure 5.
Normal arborization of nitrergic neuronal processes on muscularis in both vehicle treated and diabetes. (A) shows variance in distribution of the nitrergic processes. (B) shows two traced neurons in each group. Note the complex ramifications patterns. Blue indicates cell body and interganglionic neuronal connections. Orange color indicates the neuronal processes extending onto the muscularis. Note that varicosities were not traced. Scale bar, 25 μm.

