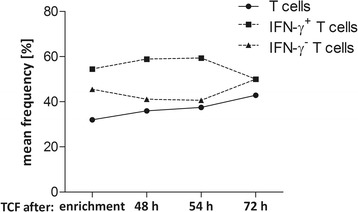
Figure 5.

Analysis of product stability. Stability of the TCF was analysed after 48 h, 54 h and 72 h of the start of leukapheresis with respect to product viability [%], frequency of CD3+CD56− T cells [%] in CD45+ leukocytes and IFN-γ+/− T cells [%] in CD3+CD56− lymphocytes. The results of independent experiments are expressed as the mean frequency [%] of viability, T cells and IFN-γ+/− T cells with regard to the different time points of storage.
