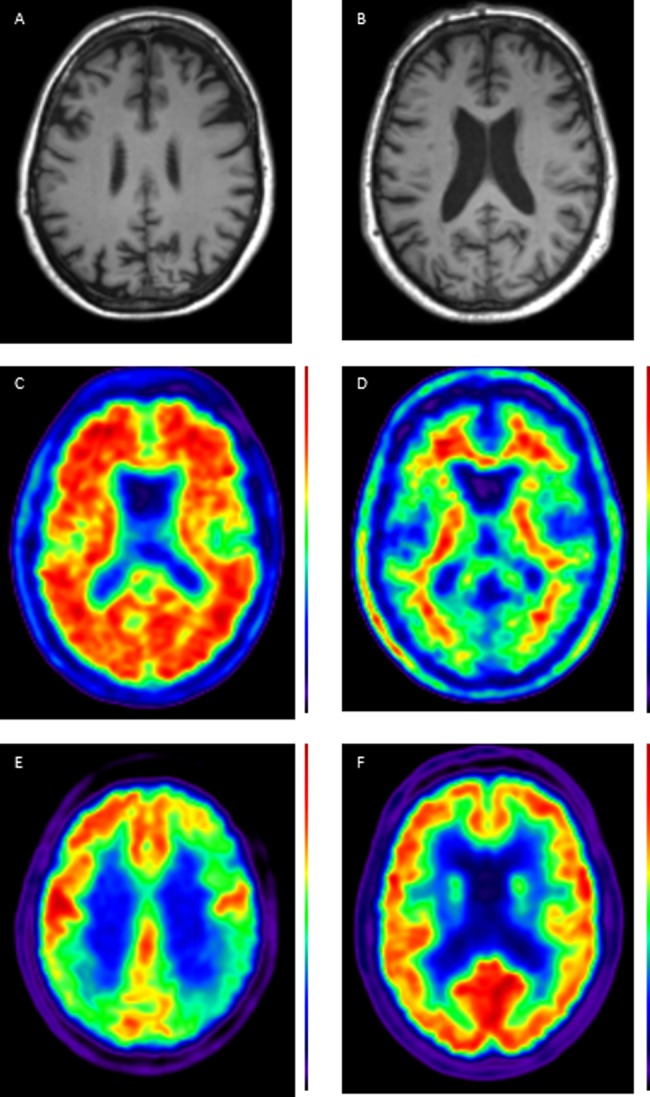
Figure 1.

Case showing clinical use of biomarkers. A 56 year old patient presented with a 5–10-year history of ‘scattiness’. Three years ago she developed difficulties reading an analogue clock, her spelling had declined and she had difficulty reading, losing her place from line to line. She received a clinical diagnosis of posterior cortical atrophy. Subsequently episodic memory became impaired. At the time of scanning, the Mini-Mental State Examination score was 19/30. A T1 volumetric MRI of the brain demonstrated a posterior pattern of cortical atrophy (A) with preserved hippocampal volumes compared with a healthy control patient (B); A 18F-florbetpair amyloid positron emission tomography (PET) scans shows widespread cortical amyloid deposition (C) compared with a healthy control (D) fludeoxyglucose (18F) PET scan demonstrates a posterior dominant pattern of hypometabolism (E) SUVR 1.0–1.4, compared with an age matched healthy control (F) SUVR 1.0–1.5. Cerebrospinal fluid examination demonstrated an elevated t-tau: 1080 pg/mL (NR 146–595); Aβ1–42 360 pg/mL ((NR 627–1322) giving a tau/Aβ1–42 ratio of 3. This case illustrates how different biomarkers can provide complementary information including regional neuronal loss, more widespread metabolic dysfunction, as well as confirming the underlying pathology—in this case, Alzheimer's disease. (NB for clinical purposes, 18F-florbetapir images should be interpreted on a grey rather than colour scale.)
