
Figure 4.
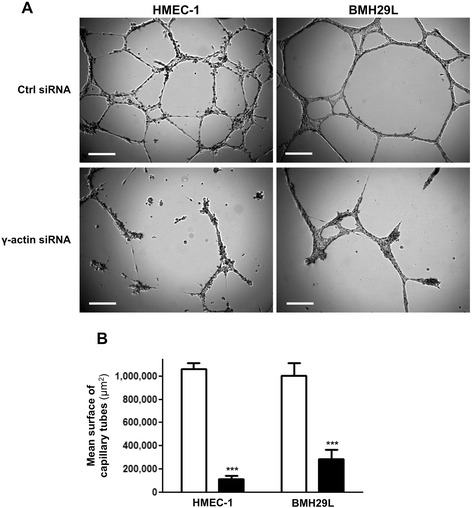
Effect of γ-actin knockdown on the formation vascular networks in vitro. (A) Representative photographs of HMEC-1 (left) and BMH29L cells (right) incubated for 8 h on Matrigel™. Cells were treated either with control (top) or γ-actin siRNA (bottom) for 72 h. Scale bar, 250 μm. (B) Histogram showing the surface occupied by vascular networks following treatment with control (white) and γ-actin siRNA (black) for 72 h. Columns, means of at least four individual experiments; bars, SE. Statistics were calculated by comparing the mean surface occupied by vascular networks per view field (at least 10 view fields per condition) for control siRNA- and γ-actin siRNA-treated cells. ***, p < 0.001.