
Figure 5.
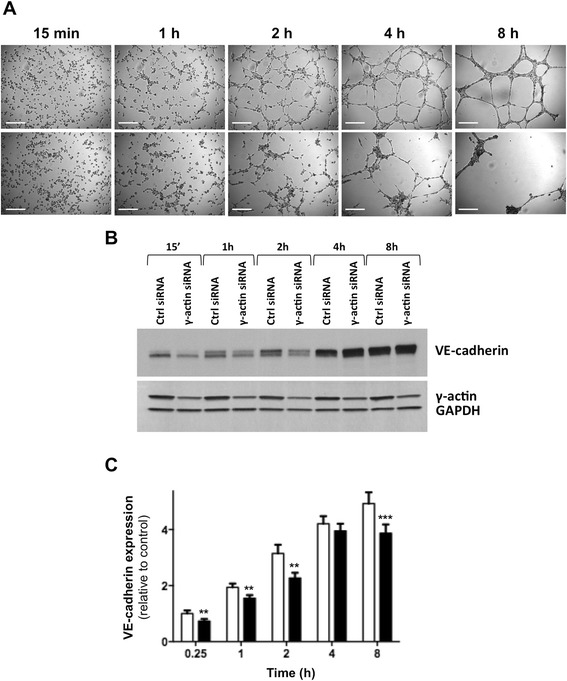
Effect of γ-actin knockdown on VE-cadherin expression during morphological differentiation of endothelial cells into vascular networks. (A) Representative photographs of HMEC-1 cells at various time points of the morphological differentiation process on Matrigel™, following treatment with control (top) and γ-actin siRNA (bottom) for 72 h. Scale bar, 250 μm. (B) Representative immunoblots of HMEC-1 cell lysates obtained at different time points of the morphological differentiation process on Matrigel™, following treatment with control and γ-actin siRNA for 72 h. Membranes were probed with anti-VE-cadherin, anti-γ-actin and anti-GAPDH (loading control) antibodies. (C) Histogram showing the relative protein expression of VE-cadherin as determined by densitometry after normalization with GAPDH (loading control), following treatment with control (white) and γ-actin siRNA (black) for 72 h. Columns, means of at least four individual experiments; bars, SE. Statistics were calculated by comparing VE-cadherin expression level in control and γ-actin siRNA-treated HMEC-1 cells; **, p < 0.01; ***, p < 0.001.