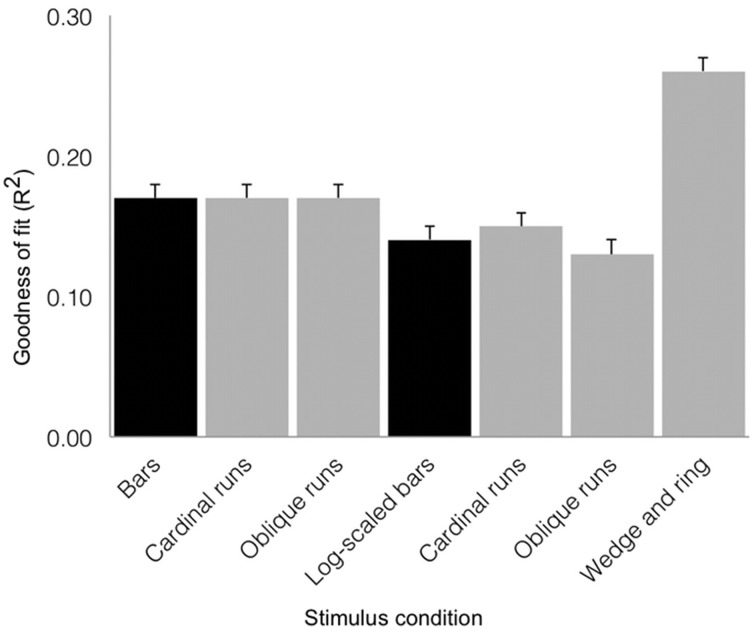
Figure 6.
Group average goodness of fit (R2) for the three stimulus configurations as derived from sum of squared residuals between the observed time series and model predictions for regions V1, V2, and V3 combined (error bars correspond to standard errors of the mean). Black shading denotes estimates from 576 volumes acquired and gray shading denotes estimates derived from 288 volumes acquired. Simultaneous wedge and ring stimulation produced better data fits, while requiring half the data compared to size-invariant or logarithmically-scaled bars collapsed across bar directions.

