
Figure 5. The disease course in naive or primed (with H1N1 or H9N2 IAVs 10–12 weeks previously) mice following challenge with the H7N9 virus.
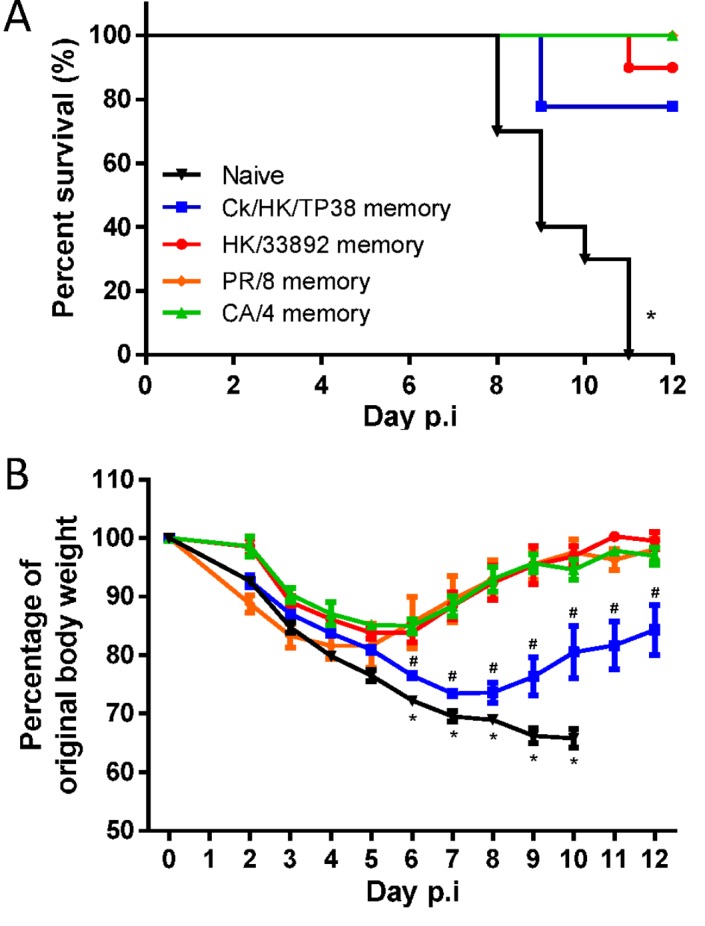
The mice were challenged with 104.5 TCID50 H7N9 virus (10 MLD50). (A) The survival ratio and (B) weight loss during the disease course. Data represent mean ± SEM, n = 8–10/group from two independent experiments. (A) * p<0.05, log-rank test, naive versus other four primed groups. (B) * p<0.05, t test, naïve versus the every other four primed groups; # p<0.05, t test, Ck/HK/TP38 versus the every other three primed groups.