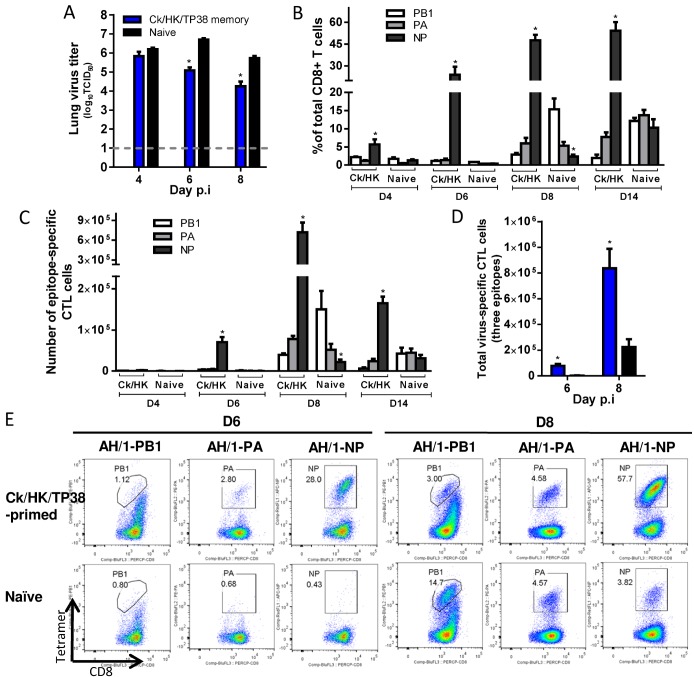
Figure 6. Comparing the primary and secondary CTL responses in naïve and Ck/HK/TP38(H9N2)-primed mice challenged with the H7N9 virus.
The mice were challenged with 103.5 TCID50 H7N9 virus (1 MLD50). (A) The virus titer in the lung and (B) proportion and (C) number of each epitope-specific CTL population and (D) the combined total number of three epitope-specific CTL populations in the BAL (data represent mean ± SEM, n = 4–5 at each time point). (A, D) * p<0.05, t test, primed versus naïve group. (B, C) * p<0.05, Tukey’s test, the indicated epitope versus the other two epitopes. (E) Representative flow cytometry plots for each tetramer-specific CTL population in the BAL. The tetramers used were specific to the epitope variants of the H7N9 virus.

