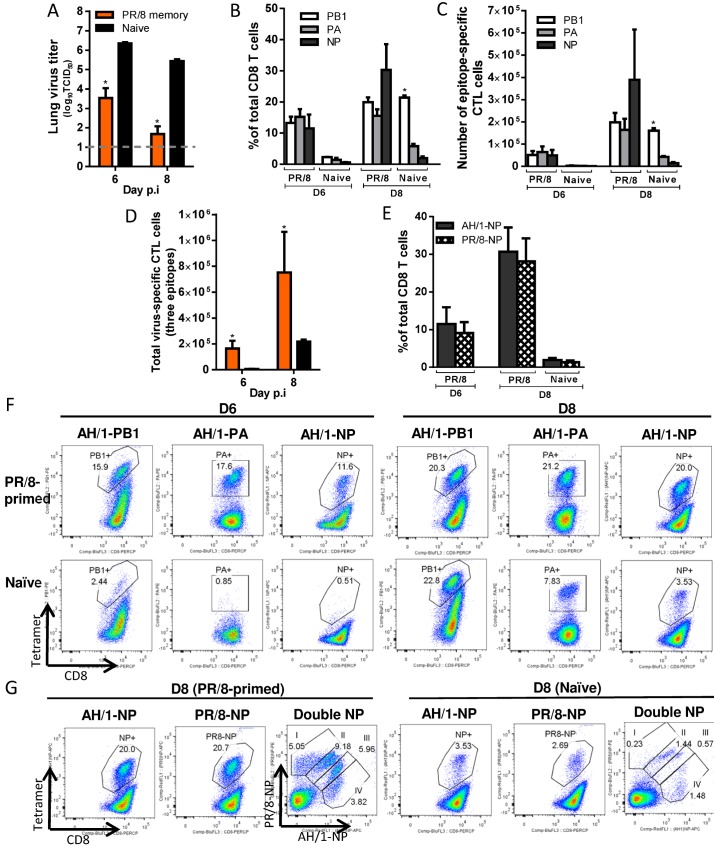
Figure 8. Comparing the primary and secondary CTL responses in naïve and PR/8(H1N1)-primed mice challenged with the H7N9 virus.
(A) The virus titer in the lung and (B) proportion and (C) number of each epitope-specific CTL population, and (D) the combined total number for the three epitope-specific CTL populations in the BAL. (E) The proportions of CTL populations specific to AH/1-DbNP366 or PR/8-DbNP366 tetramers in the BAL. (F, G) Representative flow cytometry plots for each tetramer-specific CTL population in the BAL. Details of the data analysis and comparisons are same as shown in the legend to Fig. 6.

