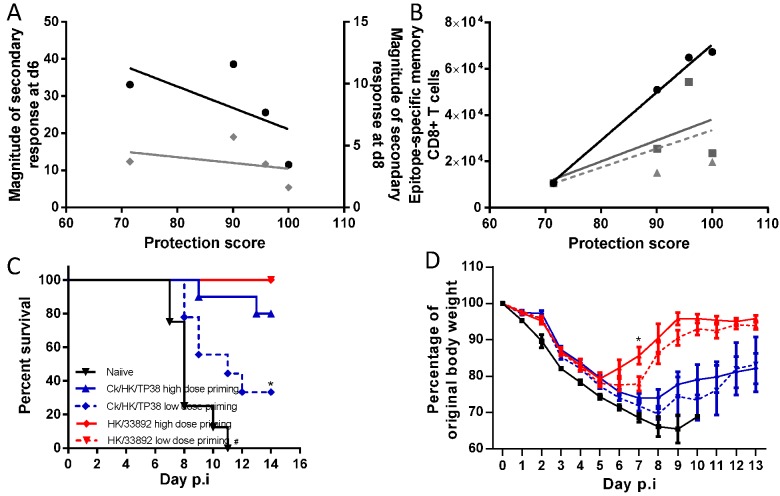
Figure 10. Correlation analysis of the protective efficacy and heterosubtypic immunity.
Pearson correlation analysis of the protective efficacy with (A) the magnitude of the H7N9 virus-specific secondary CTL response in the airways on d6 (black line, left Y axis) and d8 (grey line, right Y axis), (B) the total number of priming-virus-specific memory CTL populations generated by the homologous virus (black line); the total number epitope-specific memory CTL populations targeting the conserved and non-conserved cross-reactive epitopes in the H7N9 virus (solid grey line); the number of epitope-specific memory CTL populations which were dominantly recalled during later during challenge infection (dashed grey line). The protective efficacy score was defined by a combination of survival ratio, body weight retention and virus clearance rate; the values of each parameter were normalized to the % maximum and the final score was the average of the three parameters. For (A), because the secondary infections were conducted in different batches, the fold-relationships for a given secondary CTL response in primed mice relative to the primary CTL response in the matched naïve mice were used to enable comparison between experiments. (C) The survival ratio and (D) weight loss of the mice primed with high or low dose of the H9N2 virus after they were challenged with 104.5 TCID50 H7N9 viruses. Data represent mean ± SEM, n = 8–10/group, (C) * # p<0.05, log-rank test, * naïve versus other four primed groups, # Ck/HK/TP38 low dose versus high dose and naïve. (D) * p<0.05, t test, HK/33892 high dose versus low dose and naïve.

