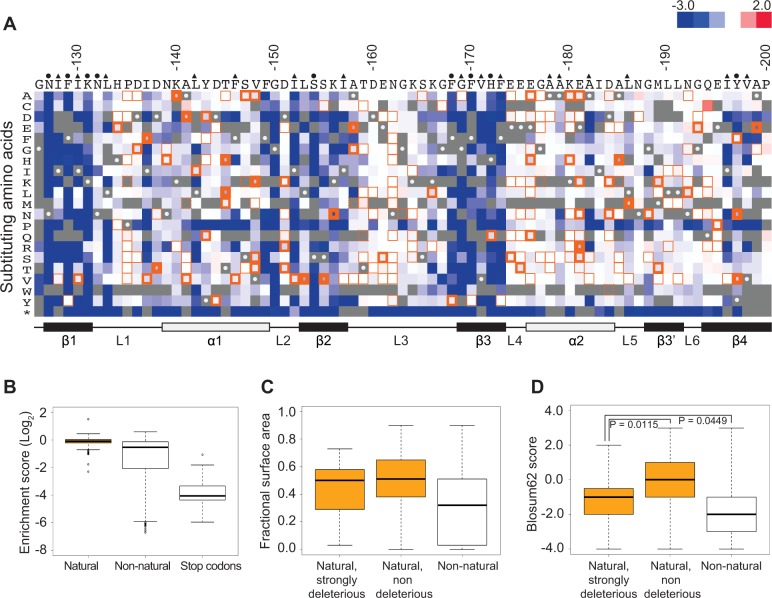
Figure 1. Functional characterization of single amino acid substitutions occurring in 52 Pab1 RRM2 homologues.
A) A heat map displaying the enrichment scores (log2 transformed) for single amino acid substitutions in the Pab1 RRM2 sequence [16]. Each column represents a site in the RRM2 sequence and each row a substitution to a specific amino acid. An asterisk designates nonsense mutations. Color ranges from blue for the most detrimental mutations to red for the most beneficial. Orange outlines depict substitutions found in at least one of the 52 Pab1 homologues that were analyzed, with effects that are non-deleterious indicated by thin lines, effects that are mildly deleterious by intermediate lines, and effects that are strongly deleterious by thick lines. Gray stands for missing data and substitutions that did not pass the 40 input read counts cutoff or other quality filtration steps. Wild-type residues are marked by gray with white central dots. Residues known to interact with poly(A) in the human RRM2 domain [30] are marked with green and residues showing low solvent accessibility (PDB ID 2K8G, fractional accessible surface area ≤ 0.1) are marked with magenta. The secondary structure of the RRM2 domain aligned to the sequence is shown below. B) The distribution of enrichment scores for amino acid substitutions found in Pab1 RRM2 homologues (natural) and for all other substitutions that do not occur in those sequences (non-natural). Shown also is the distribution of stop codons to highlight enrichment scores of null mutations. C) Box plots displaying the fractional surface area for the equivalent yeast residues in the human RRM2 structure in complex with poly(A) (PDB ID 1CVJ). Shown are the fractional surface area for the 17 amino acid substitutions in Pab1 RRM2 homologues that displayed enrichment scores lower than −0.5, the other naturally occurring substitutions, and the non-natural substitutions. D) Box plots depicting the Blosum62 score of the same substitution groups as in C. p-values from Wilcoxon rank sum tests for the differences between the score distributions are shown.

