
Figure 1.
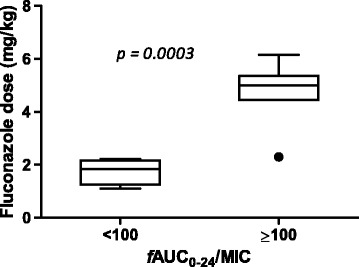
The box plot of fluconazole dose in milligrams per kilogram stratified by the patients achieving and not achieving the PK/PD index, free drug area under the concentration-time curve from 0 to 24 hours ( f AUC 0–24 /MIC).
Official websites use .gov
A
.gov website belongs to an official
government organization in the United States.
Secure .gov websites use HTTPS
A lock (
) or https:// means you've safely
connected to the .gov website. Share sensitive
information only on official, secure websites.
The box plot of fluconazole dose in milligrams per kilogram stratified by the patients achieving and not achieving the PK/PD index, free drug area under the concentration-time curve from 0 to 24 hours ( f AUC 0–24 /MIC).