
Figure 1.
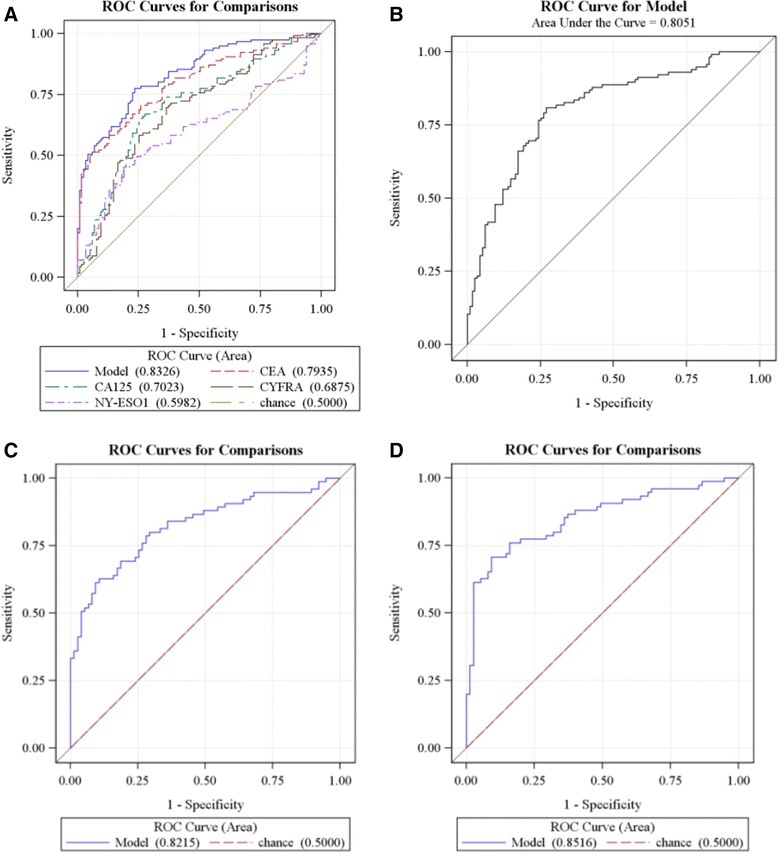
ROC curve analyses of training data set ( n = 230) (A and B) and validation set ( n = 150) (C and D). Panel A shows ROC curves for prediction of LC using multiple logistic regression weightings for each individual biomarker and a model combining all 4 biomarkers. The AUC values are 0.60, 0.79, 0.70, 0.69, and 0.83 for NY-ESO-1, CEA, CA125, CYFRA 21–1, and the combined panel, respectively; Panel B is a ROC curve generated from the 4-biomarker panel using the MoM scoring method (AUC value = 0.81); Panel C shows a ROC curve of the validation set for prediction of LC using the MLR method (AUC = 0.82), and Panel D shows the same data using MoM transformation (AUC = 0.85).