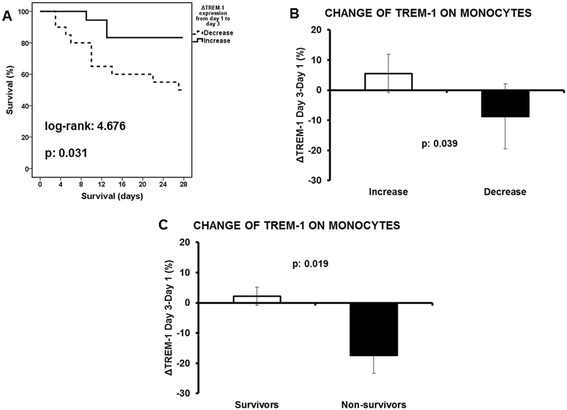
Figure 3.

Study primary endpoint: impact of TREM-1 expression on final outcome A) Survival analysis comparing patients with decrease of TREM-1 expression from day 1 to day 3 (n = 20) and patients with increase of TREM-1 expression from day 1 to day 3 (n = 18); B) Respective comparisons of the change of the expression of TREM-1 on circulating monocytes are provided; C) Comparison of the change of TREM-1 expression on circulating monocytes between day 3 and day 1 between survivors (n = 59) and non-survivors (n = 16). P values of comparisons are provided.
